In this post I describe how I configured Elasticsearch, Logstash and Kibana (ELK) to monitor the bank statement from the CHARY transactions.
Preconditions
ELK is a monitoring tool to observe logfiles. Here I described, how I installed the linux servers for it:
@achimmertens/how-to-install-an-amazon-linux-server
Here I described, how I installed ELK:
@achimmertens/how-to-install-an-elk-stack-on-an-amazon-linux-server
And in this article I describe what I did to interprete some raw logfiles and turn them into readable figures.
What to display with ELK
I have installed a blockchain based system, which allows people to donate money into a pot and a community to decide, which project/person shall get the money. This is very effective charity without man in the middle (NGOs). There are only exchange costs (what NGOs also have). For details see https://chary.org/faq.html
Charity workers earn so called "CHARY" token, which they can sell agains HIVE, which is real money and which can be changed into an arbitrary currency.
The donators buy CHARY with HIVE here: https://hive-engine.com/?p=market&t=CHARY
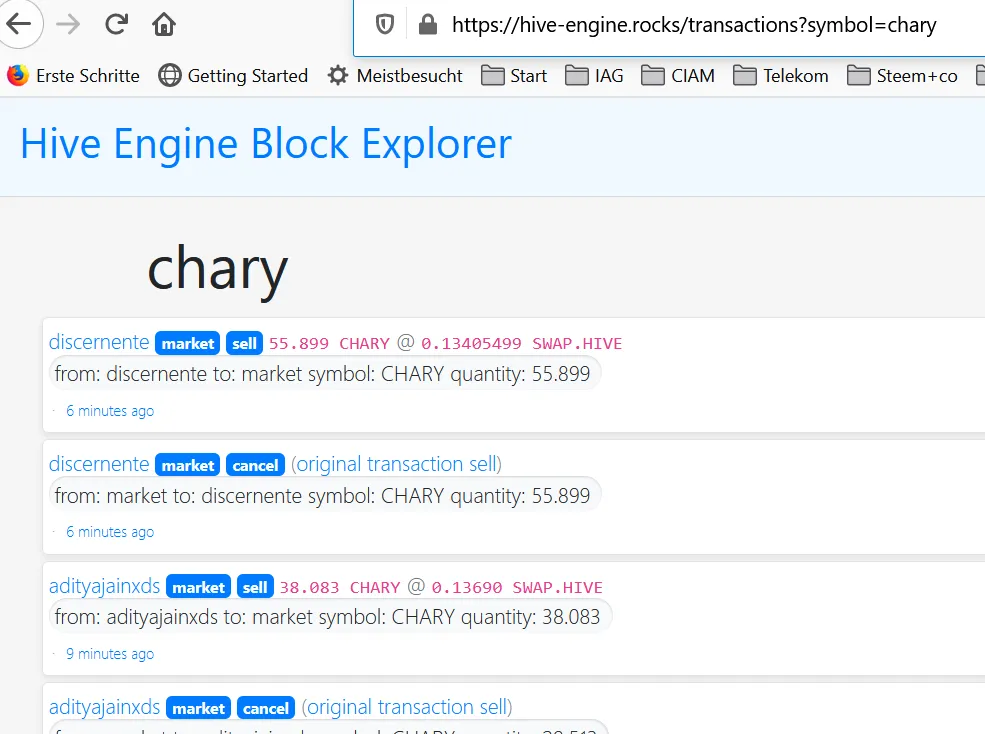
This page shows, who has sold and bought CHARY: https://hive-engine.rocks/transactions?symbol=chary, which is like a bank statement.
It is not very human readable. It looks like this:
Proper logfile
ELK can import logfiles, but they have to have a repeating, clear structure.
So I created the following script to get these logfiles:
[ec2-user@ip-172-31-69-122 ~]$ vim charycurl.sh
#!/bin/sh
DATE=date -I
echo "DATE = "$DATE
LOG="/home/ec2-user/charycurl_$DATE.log"
echo "Log = "$LOG
curl -XPOST -H "Content-type: application/json" -d '{ "jsonrpc": "2.0", "method": "find", "params": { "contract": "market", "table": "tradesHistory", "query": { "symbol": "CHARY"}, "limit":1000, "offset": 0 }, "id": 1 }' 'https://api.hive-engine.com/rpc/contracts' > /home/ec2-user/charycurl.log
sed s/},{"_id"/="_id"/g /home/ec2-user/charycurl.log | tr "=" "\n" > /home/ec2-user/charycurl3.log
sed s/^.*{"_id"/"_id"/g /home/ec2-user/charycurl3.log > /home/ec2-user/charycurl4.log
sed s/}]}$//g /home/ec2-user/charycurl4.log > $LOG
cat $LOG >> /home/ec2-user/charycurlcons.log
#scp -i "Discordbot.pem" /home/ec2-user/charycurlcons.log ec2-user@ec2-35-173-42-30.compute-1.amazonaws.com:/home/ec2-user/charycurlcons.log
As a result a file is created, which has the following content:
[ec2-user@ip-172-31-69-122 ~]$ tail -n2 charycurlcons.log
"_id":645003,"type":"sell","buyer":"achimmertens","seller":"hive09","symbol":"CHARY","quantity":"36.245","price":"0.08000000","timestamp":1609964157,"volume":"2.89960000","buyTxId":"662c4ea31153245ba3c488e7ed5418a596a4a782","sellTxId":"50b15bbeedec51865da5f86ef1cb0c2f85869268"
"_id":646192,"type":"sell","buyer":"achimmertens","seller":"nane","symbol":"CHARY","quantity":"35.464","price":"0.08000000","timestamp":1609986285,"volume":"2.83712000","buyTxId":"662c4ea31153245ba3c488e7ed5418a596a4a782","sellTxId":"10d76578681932e351e1955449faa81c1b80fb3c"
Then I have created a cronjob to run this script daily at 4:50 AM:
[ec2-user@ip-172-31-69-122 ~]$ sudo crontab -l
50 4 * * * /home/ec2-user/charycurl.sh >> /home/ec2-user/cron.log
(You may contact this site for crontab format questions: https://stackoverflow.com/questions/8938120/how-to-run-cron-once-daily-at-10pm)
As a result I get a file, which is daily growing (it's not so big) and contains all transactions in always the same manner: charycurlcons.log
I let this script run on a tiny AWS Linux machine (T2.small), which is for free. So it can stay there in the background and just daily collect the logfiles.
Once a month I put this logfile to the ELK mashine via this command:
scp -i "Discordbot.pem" /home/ec2-user/charycurlcons.log ec2-user@ec2-35-173-42-30.compute-1.amazonaws.com:/home/ec2-user/charycurlcons.log
The content of the home directory looks like this:
[ec2-user@ip-172-31-69-122 ~]$ ll
total 172
…
-rw-rw-r-- 1 ec2-user ec2-user 834 Dec 18 07:50 charycurl_2020-12-18.log
-rw-r--r-- 1 root root 3095 Dec 19 04:50 charycurl_2020-12-19.log
…
-rw-r--r-- 1 root root 3103 Jan 7 04:50 charycurl_2021-01-07.log
-rw-r--r-- 1 root root 3141 Jan 7 04:50 charycurl3.log
-rw-r--r-- 1 root root 3106 Jan 7 04:50 charycurl4.log
-rw-rw-r-- 1 ec2-user ec2-user 41522 Jan 7 04:50 charycurlcons.log
-rw-rw-r-- 1 ec2-user ec2-user 3161 Jan 7 04:50 charycurl.log
-rwxrwxrwx 1 ec2-user ec2-user 838 Dec 23 14:12 charycurl.sh
-rw-r--r-- 1 root root 1393 Jan 7 04:50 cron.log
-r-------- 1 ec2-user ec2-user 3343 Dec 23 12:07 Discordbot.pem
-rw------- 1 ec2-user ec2-user 0 Oct 22 06:14 nohup.out
…
[ec2-user@ip-172-31-69-122 ~]$
Configuring ELK
ELK needs to run on a bigger machine then T2.small. I have installed it on an Amazon AWS with 2 CPUs, 8 GB RAM, 8 GB Storage. As mentioned above, here is my description, how I installed the linux machine and then how I installed ELK
I start elasticsearch with this command:
[ec2-user@ip-172-31-63-160 ~]$ sudo service elasticsearch start
It takes about one minute to start.
After that I start Kibana:
[ec2-user@ip-172-31-63-160 ~]$ sudo service kibana start
One can then reach kibana via a browser:
http://ec2-35-168-36-108.compute-1.amazonaws.com:5601
Now the trick is, to get the logfile into kibana.
Therefore we need to create a proper index which fits to the logfile. It took me a while and some research, but at the end I got this config file:
[ec2-user@ip-172-31-63-160 ~]$ cat charycurl.conf
input {
file {
path => "/home/ec2-user/charycurlcons.log"
# start_position => "beginning"
start_position => "end"
sincedb_path => "/dev/null"
}
}
filter {
grok {
match =>
{ "message" =>
['_id":%{NUMBER:ID},"type":"%{DATA:Type}","buyer":"%{DATA:Buyer}","seller":"%{DATA:Seller}","symbol":"%{DATA:Symbol}","quantity":"%{NUMBER:CHARY:float}","price":"%{NUMBER:Price:float}","timestamp":%{DATA:time},"volume":"%{NUMBER:HIVE:float}","buyTxId":"%{DATA:BuyTxId}","sellTxId":"%{DATA:SellTxId}']
}
}
date
{
match => [ "time","UNIX" ]
}
}
output {
elasticsearch {
hosts => "http://localhost:9200"
index => "chary"
}
stdout {}
}
[ec2-user@ip-172-31-63-160 ~]$
The "grok" part "translates" the repeating rows from the log file into the fields, that are imported with logstash into elasticsearch.
Here are some pages, that helped me:
https://stackoverflow.com/questions/34347258/logstash-to-convert-epoch-timestamp
http://grokdebug.herokuapp.com/
https://github.com/elastic/logstash/blob/v1.4.2/patterns/grok-patterns
https://riptutorial.com/de/sed/example/5814/ersetzen-sie-strings-direkt-in-einer-datei
https://www.elastic.co/guide/en/elasticsearch/reference/current/mapping.html
https://www.elastic.co/guide/en/elasticsearch/reference/5.0/docs-reindex.html
https://github.com/hive-engine/steemsmartcontracts-wiki/
https://www.elastic.co/guide/en/logstash/current/plugins-inputs-file.html#plugins-inputs-file-start_position
https://stackoverflow.com/questions/54035628/convert-field-number-to-date-on-kibana-elastic-search
And now, we have to load the logfile, with the help of the config file, into elasticsearch via logstash:
sudo /usr/share/logstash/bin/logstash -f /home/ec2-user/charycurl.conf --path.settings /etc/logstash
Configuring Kibana
The data is now in kibana. One can see the following result in the Discover tab, by clicking on the chary* Index filter and adjusting the right time frame:
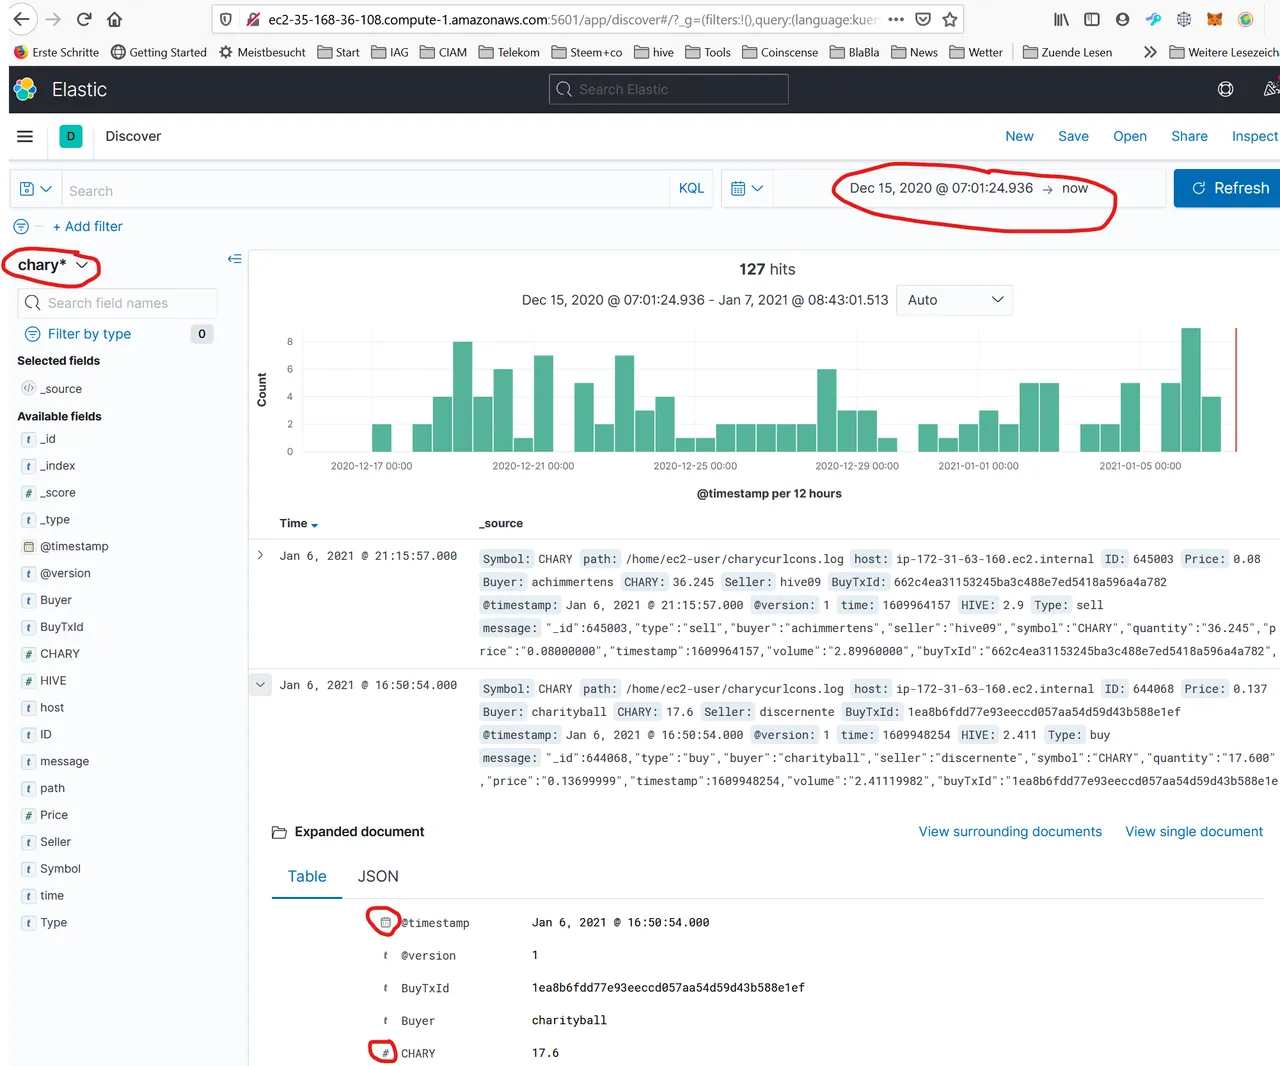
It shows the number of log events in 12h time slots. When you click on an entry and expand it, then you can see the imported fields and their types. To get a proper view in the dashboard, the types have to be in the correct form. I.e. the type of CHARY and HIVE has to be a number (float), the type of the timestamp has to be "date",…
For this the proper logstash conf file is mandatory.
The most often failures are:
- Check the correct time frame
- Check the index
- The fields are not in the correct format
The index was created during import due to the logstash config entry 'index => "chary"'.
If some data is wrong in Kibana (Version 7), one can delete the index via Management/Stack Management/Index Management/checking the index/manage index/delete index.
The next step is to interprete the data. One can do it with "visualize":
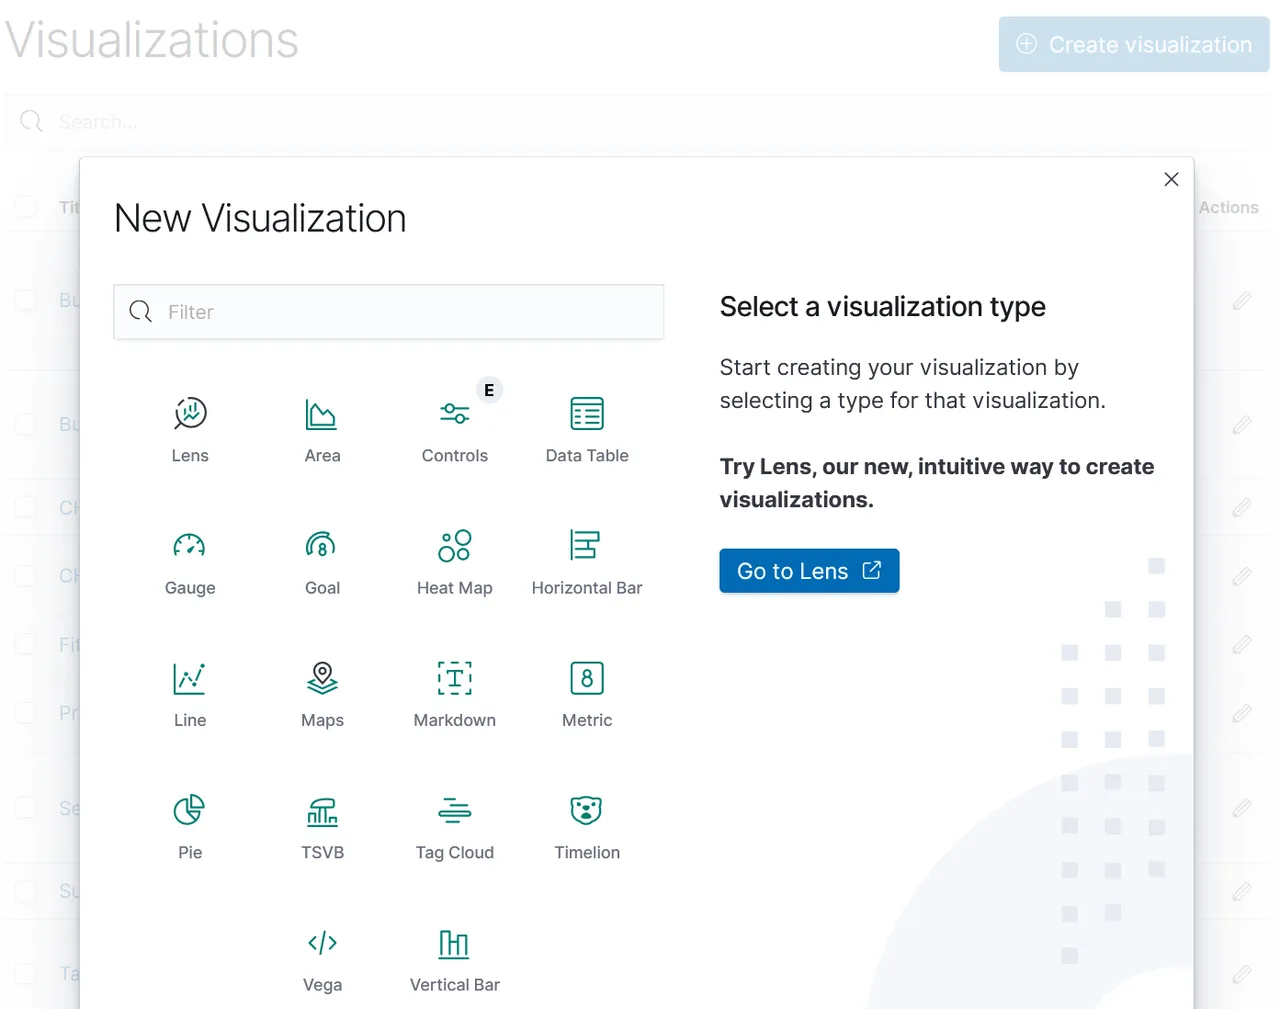
There are several methods. The easiest is "Lens", because you can drag and drop the fields into the axis.
I recommend to watch some videos to understand how the visulization in Kibana works.
https://kb.objectrocket.com/elasticsearch/how-to-visualize-csv-data-with-kibana-122
https://www.elastic.co/de/blog/importing-csv-and-log-data-into-elasticsearch-with-file-data-visualizer
Here I show an visualization example with vertical bars. We need to select an index, in our case "chary*":
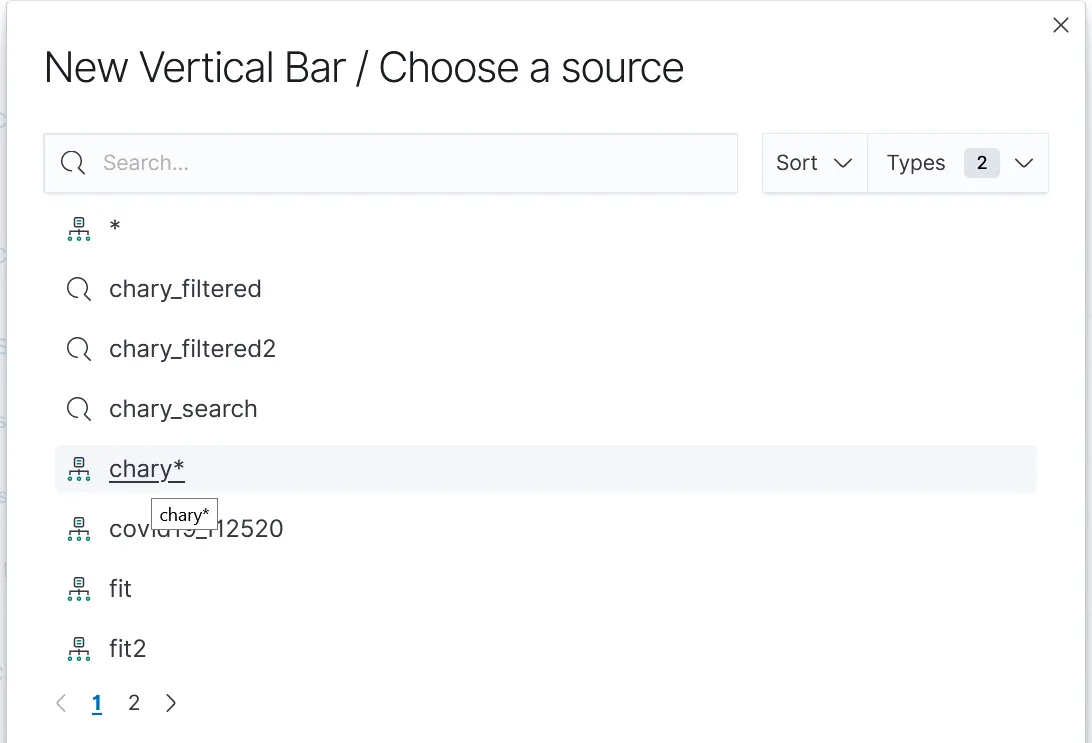
The following example describes, how to create a figure, that shows the top 5 sellers of CHARY and how much HIVE they got for it:
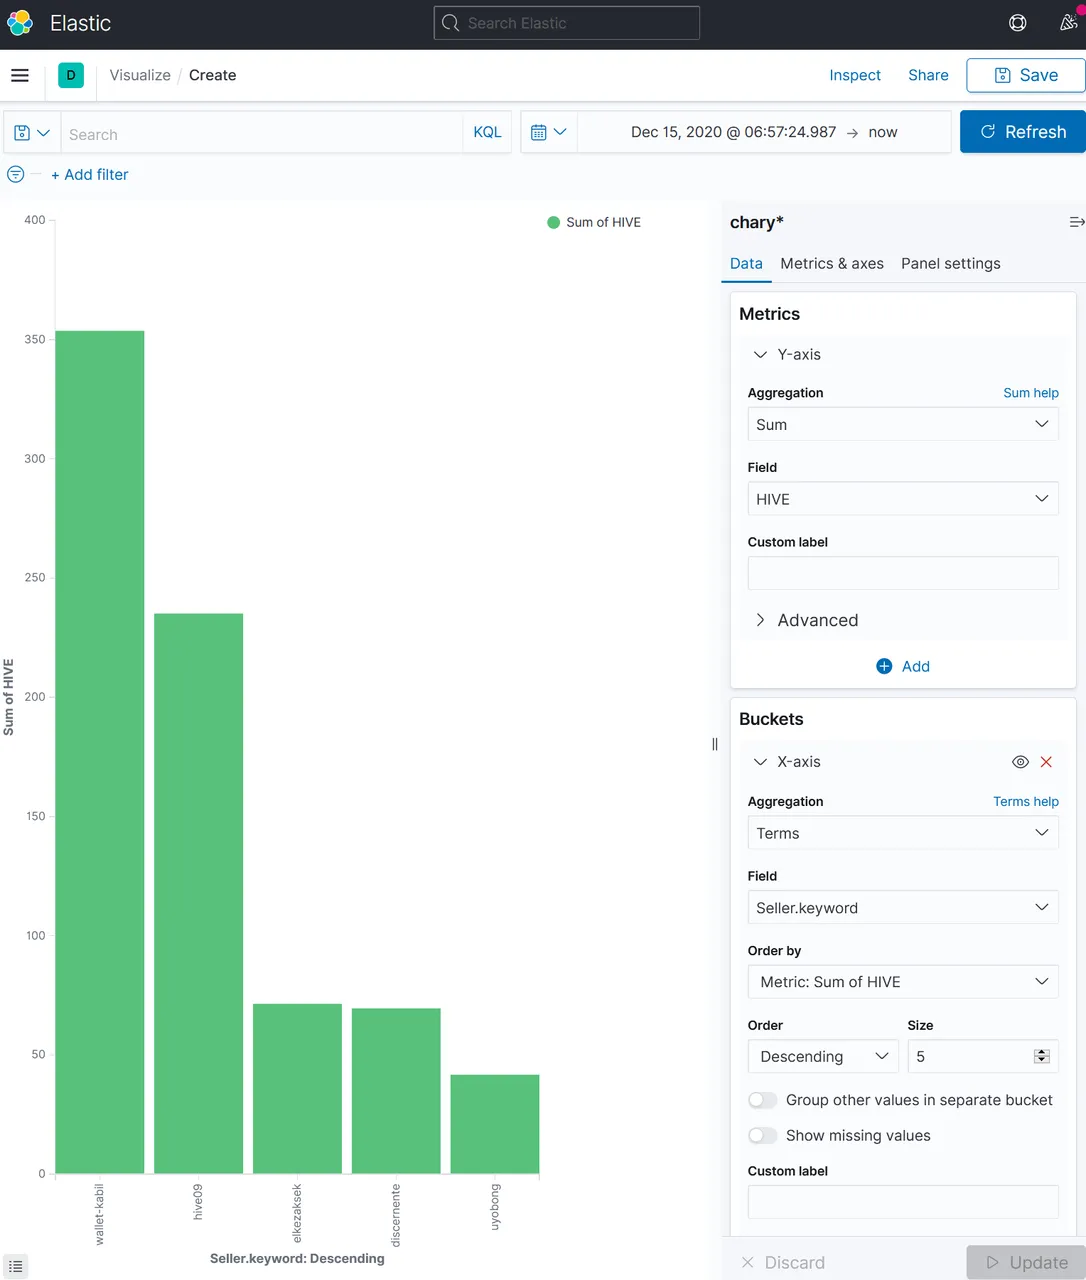
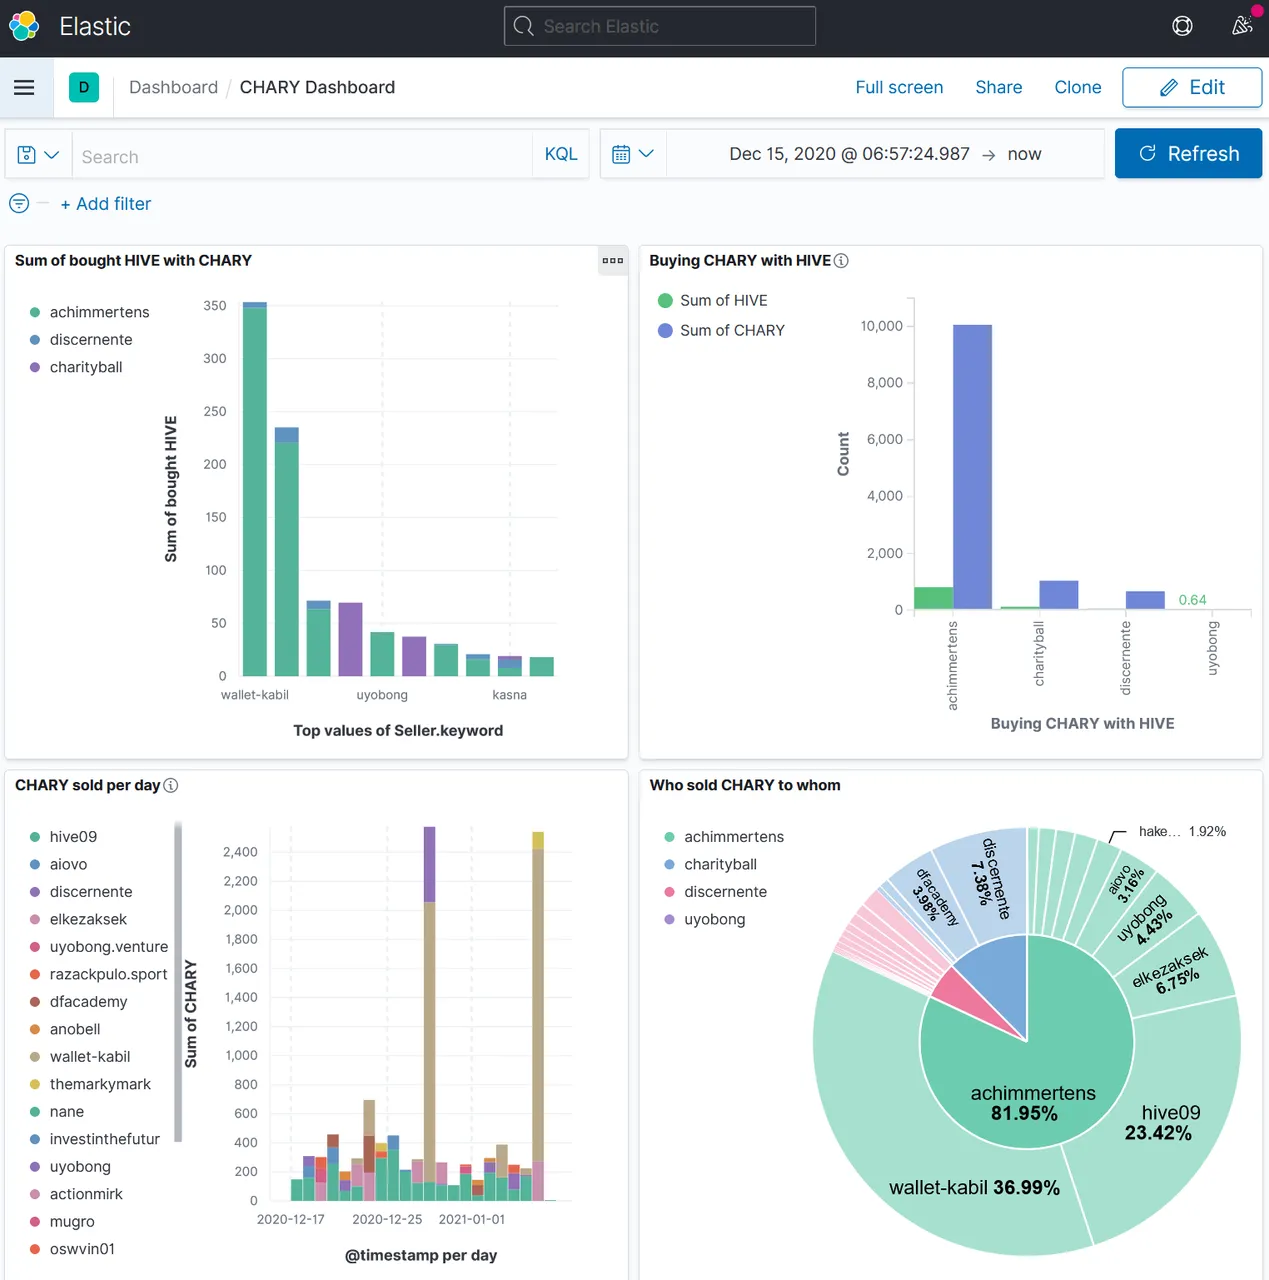
One can create several figures and concentrate them in one view, the "Dashboard":
Monthy work
I want to have a monthly dashboard snapshot. Therefore I let the above described "charycurl.sh" script run once a day on a small AWS server.
Once a month I start the ELK server and start there all three components:
sudo service elasticsearch start
sudo service kibana start
sudo /usr/share/logstash/bin/logstash -f /home/ec2-user/charycurl.conf --path.settings /etc/logstash
When the following message appears:
[2021-01-08T05:59:16,725][INFO ][filewatch.observingtail ][main][e4bee07e01db89e136a9142ddb1841dc26c5a9f1185991adaf6c9234979b393a] START, creating Discoverer, Watch with file and sincedb collections
[2021-01-08T05:59:17,050][INFO ][logstash.agent ] Successfully started Logstash API endpoint {:port=>9600}
Then I wait a few seconds to be sure, that everything is up and running.
Then, on the other server, I put the logfile to the ELK server:
[ec2-user@ip-172-31-69-122 ~]$ scp -i "Discordbot.pem" /home/ec2-user/charycurlcons.log ec2-user@ec2-3-239-84-180.compute-1.amazonaws.com:/home/ec2-user/charycurlcons.log
The authenticity of host 'ec2-3-239-84-180.compute-1.amazonaws.com (172.31.63.160)' can't be established.
ECDSA key fingerprint is SHA256:4qesrW64Z4AAl6Bf5QLUluks+zbV0O/jDMCesGJ7qiY.
ECDSA key fingerprint is MD5:15:f9:ff:1f:5c:f0:53:a0:12:f3:78:4b:42:a8:e3:5c.
Are you sure you want to continue connecting (yes/no)? yes
Warning: Permanently added 'ec2-3-239-84-180.compute-1.amazonaws.com' (ECDSA) to the list of known hosts.
charycurlcons.log 100% 41KB 11.7MB/s 00:00
On th ELK Server, the new content appears in the logstash output:
…
{
"@version" => "1",
"Seller" => "anderssinho",
"Price" => 0.08,
"BuyTxId" => "662c4ea31153245ba3c488e7ed5418a596a4a782",
"HIVE" => 0.40584,
"Type" => "sell",
"Symbol" => "CHARY",
"message" => ""_id":646893,"type":"sell","buyer":"achimmertens","seller":"anderssinho","symbol":"CHARY","quantity":"5.073","price":"0.08000000","timestamp":1610009943,"volume":"0.40584000","buyTxId":"662c4ea31153245ba3c488e7ed5418a596a4a782","sellTxId":"8cdf6785d4489d3ef7a0abfbf83c990585c73da4"",
"host" => "ip-172-31-63-160.ec2.internal",
"time" => "1610009943",
"@timestamp" => 2021-01-07T08:59:03.000Z,
"Buyer" => "achimmertens",
"ID" => "646893",
"CHARY" => 5.073,
"path" => "/home/ec2-user/charycurlcons.log"
}
…
I can immediately refresh the Kibana dashboard and copy and past the figures into a blogpost on @achimmertens
Regards, Achim Mertens