Hello together,
as you may know, now I am able to observe some token transactions. Here are some examples:
$BEER, $POB, $LIST and $CHARY.
In this article I write how I did it.
Content:
- Set up Raspberry Pi
- Installation of Docker
- Installatipon of Elasticsearch
- Installation of Kibana
- What is with Logstash
- Uploading Data to Elasticsearch via Script
- Preparing Kibana
- Sum Up
Set up Raspberry Pi
First, I had set up my Raspberry Pi.
Installation of docker
I did the following steps 1:1 from https://www.shellhacks.com/raspberry-pi-docker-install-docker-on-raspberry-pi/
curl -fsSL https://download.docker.com/linux/raspbian/gpg | sudo apt-key add -
echo "deb [arch=armhf] https://download.docker.com/linux/raspbian $(lsb_release -cs) stable" | sudo tee /etc/apt/sources.list.d/docker-ce.list
sudo apt-get update
sudo apt-get install docker-ce
sudo pip3 install docker-compose
sudo systemctl start docker
sudo docker run hello-world
sudo systemctl enable docker
sudo usermod -aG docker $USER
Installing Elasticsearch
Install the docker image:
pi@raspberrypi:~ $ docker run comworkio/elasticsearch:latest-arm
Unable to find image 'comworkio/elasticsearch:latest-arm' locally
latest-arm: Pulling from comworkio/elasticsearch
c06905228d4f: Extracting [===========> ] 5.046MB/22.71MB 46cbc764dfc9: Download complete
…
Stop it via 2*strg-c
Show, if it was installed:
pi@raspberrypi:~ $ docker images
REPOSITORY TAG IMAGE ID CREATED SIZE
comworkio/elasticsearch latest-arm bf70c7ec0bb5 3 weeks ago 1.18GB
Start it again with the right parameters:
docker run -p 9200:9200 -p 9300:9300 -e "discovery.type=single-node" comworkio/elasticsearch:latest-arm
Check if it runs:
pi@raspberrypi:~/chary $ curl -4 localhost:9200
{
"name" : "elasticsearch",
"cluster_name" : "elasticsearch",
"cluster_uuid" : "fNPI3eJeR9qUJy6A_sZfuA",
"version" : {
"number" : "7.10.2",
"build_flavor" : "default",
"build_type" : "tar",
"build_hash" : "747e1cc71def077253878a59143c1f785afa92b9",
"build_date" : "2021-01-13T00:42:12.435326Z",
"build_snapshot" : false,
"lucene_version" : "8.7.0",
"minimum_wire_compatibility_version" : "6.8.0",
"minimum_index_compatibility_version" : "6.0.0-beta1"
},
"tagline" : "You Know, for Search"
}
pi@raspberrypi:~/chary $ netstat -na | grep 9200
tcp 0 0 0.0.0.0:9200 0.0.0.0:* LISTEN
tcp 0 0 127.0.0.1:34124 127.0.0.1:9200 VERBUNDEN
See also:
https://gitlab.comwork.io/oss/elasticstack/elasticstack-arm
https://www.elastic.co/guide/en/elasticsearch/reference/current/docker.html
Installation of Kibana
One can install kibana via docker with this command:
docker pull comworkio/kibana:latest-arm
But i didn't test it, because I already had kibana installed without container.
I did it like this:
Download the Kibana Debian package from Elastic’s repository.
wget https://artifacts.elastic.co/downloads/kibana/kibana-7.7.0-amd64.deb
Install the downloaded package using the dpkg
package installer.
sudo dpkg -i --force-all kibana-7.7.0-amd64.deb
Move the redistributed NodeJS to another folder (or delete it completely) and create a new empty directory node in the Kibana installation directory.
sudo mv /usr/share/kibana/node /usr/share/kibana/node.OLD
sudo mkdir /usr/share/kibana/node
Next, download version 10.19.0 of NodeJS. This is the required version of NodeJS for Kibana 7.7.0. If you are installing another version of Kibana, you may want to check what NodeJS version it requires. The best way to do that is to start the Kibana service and it will tell you.
sudo wget https://nodejs.org/download/release/v10.19.0/node-v10.19.0-linux-armv7l.tar.xz
Unpack the TAR and move the content to the node directory under the Kibana installation directory.
sudo tar -xJvf node-v10.19.0-linux-armv7l.tar.xz
pi@raspberrypi:/etc/kibana $ sudo mv ./node-v10.19.0-linux-armv7l/* /usr/share/kibana/node
(You may also want to create symlinks for the NodeJS executable and its tools.
sudo ln -s /usr/share/kibana/node/bin/node /usr/bin/node
sudo ln -s /usr/share/kibana/node/bin/npm /usr/bin/npm
sudo ln -s /usr/share/kibana/node/bin/npx /usr/bin/npx)
Configure Kibana to accept requests on any IP address on the device.
pi@raspberrypi:/etc/kibana $ sudo cp kibana.yml kibana.yml_orig
sudo vi /etc/kibana/kibana.yml
Set the server.host
setting to 0.0.0.0
like this:
server.host: "0.0.0.0"
You can run Kibana with:
sudo service kibana start
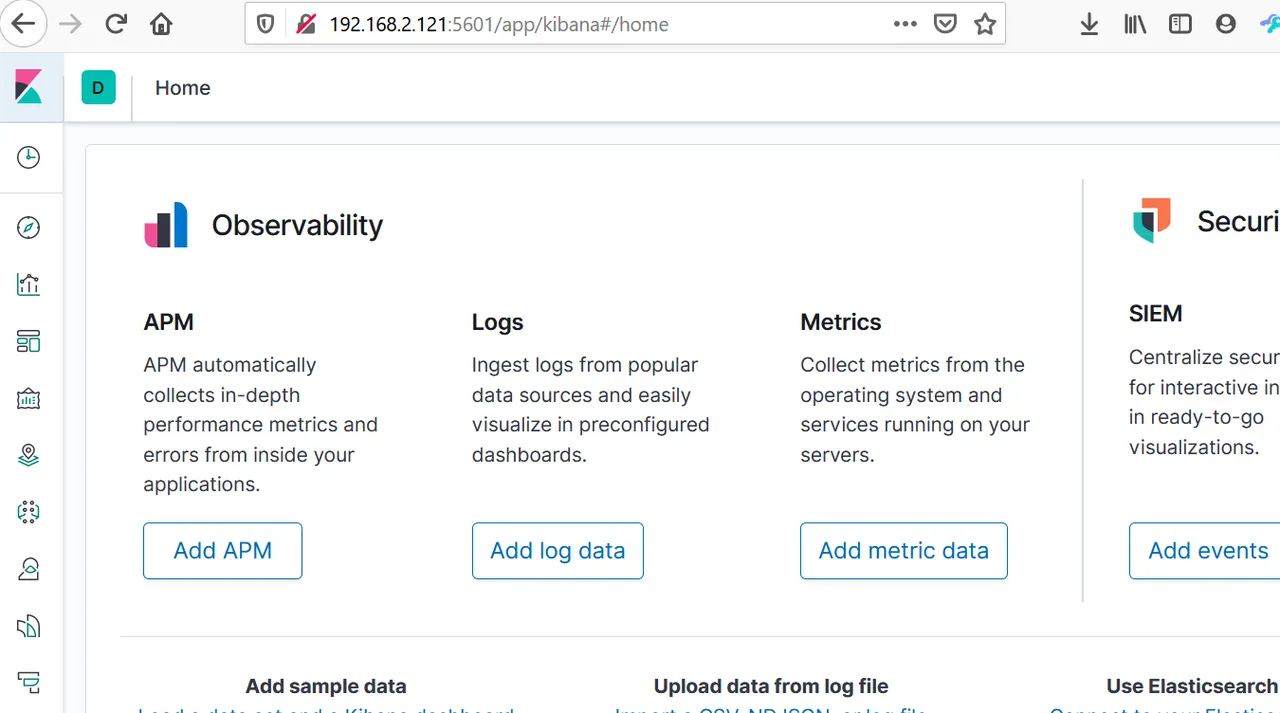
Access the kibana GUI via your browser: http://192.168.2.121:/5601
You should see something like this:
See also:
Docker:
https://gitlab.comwork.io/oss/elasticstack/elasticstack-arm
Kibana installation:
https://www.elastic.co/guide/en/kibana/current/deb.html#install-deb
https://logz.io/blog/elk-stack-raspberry-pi/
https://gist.github.com/vjm/d206171be8971294f98b
https://www.thepolyglotdeveloper.com/2018/03/install-nodejs-raspberry-pi-zero-w-nodesource/
https://github.com/nodesource/distributions/blob/master/README.md#debinstall
https://github.com/elastic/kibana/issues/3213
https://toddysm.com/2020/06/09/learn-more-about-your-home-network-with-elastic-siem-part-1-setting-up-elastic-siem/
What is with Logstash
Usually the three tools Elasticsearch, Logstash and Kibana (ELK) are used together. Logstash collects the logfiles and prepares them for Elasticsearch, which is a database, that can be fed and read out via port 9200. Kibana is the Graphical User Interface (GUI) for Elasticsearch.
I have established such a system on Amazon Web Services (AWS), as described here.
But with the Raspberry Pi Logstash doesn't work. Raspberry has an ARM-processor and the newest versions of logstash are not supported for ARM. I couldn't find any version that works, even with docker.
So at the end, I gave it up and tried to find a workaround.
And, hey, it works. I am very proud of myself. I managed to write a script, which delivers data in a form, that I can upload directly into Elasticsearch. Here we go:
Uploading Data to Elasticsearch via Script
This script collects data from the web API https://api.hive-engine.com/rpc/contracts. This is a kind of bank statement. Not very human readable. It looks like this:
{"jsonrpc":"2.0","id":1,"result":[{"_id":1021421,"type":"buy","buyer":"brutalmonkey","seller":"adityajainxds","symbol":"CHARY","quantity":"1.000","price":"0.07000000","timestamp":1620084681,"volume":"0.07000000","buyTxId":"e7ea5d64afa2cf550bc25158fb53905edcaca975","sellTxId":"6cf1271d5e553b55d4be04e208c77afd2212d7c8"},
...
Then the script converts the data into json format, which is readable by Elasticsearch. It looks like this:
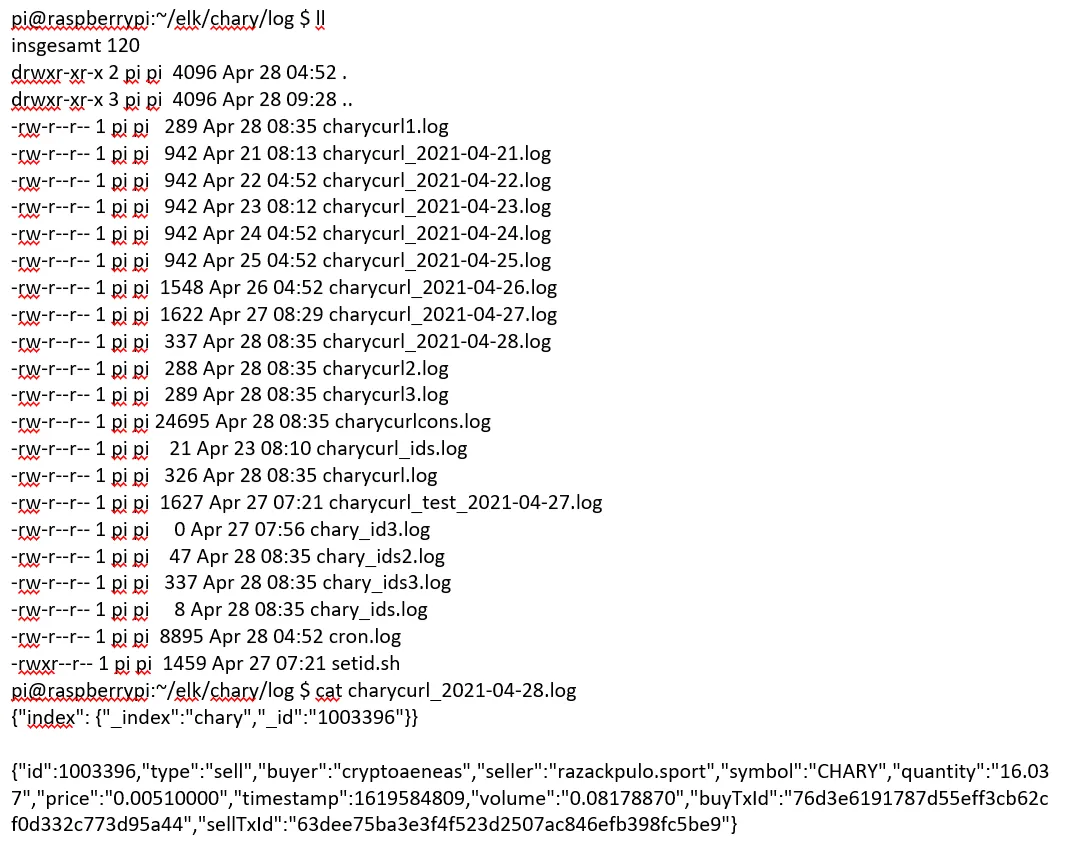
{"index": {"_index":"chary","_id":"1021421"}}
{"id":1021421,"type":"buy","buyer":"brutalmonkey","seller":"adityajainxds","symbol":"CHARY","quantity":"1.000","price":"0.07000000","timestamp":1620084681,"volume":"0.07000000","buyTxId":"e7ea5d64afa2cf550bc25158fb53905edcaca975","sellTxId":"6cf1271d5e553b55d4be04e208c77afd2212d7c8"}
The "_index"-field is important, because with this, the dataset is pumped into the right database "chary".
Setting the "_id"-field gives us the opportunity to import the data unique. This means, if a dataset is double (this happens in the log files or when you run the script more than once a day), only one dataset (the last) is taken and we don't have double entries.
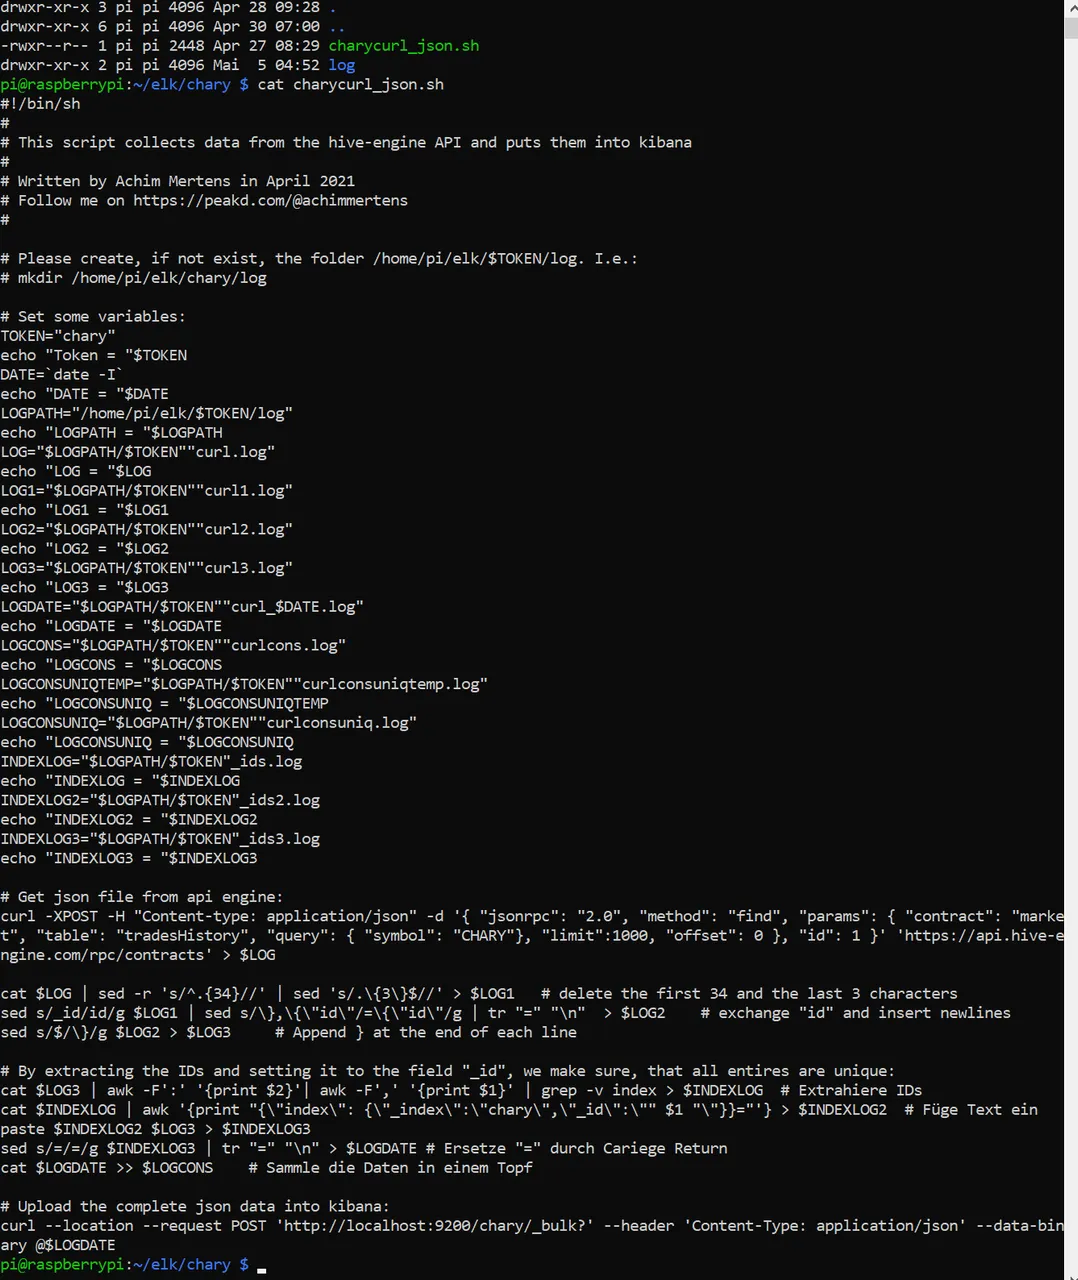
And then the script pumps via bulkload this data into Elasticsearch, where it can be interpreted and graphically represented via Kibana.
#!/bin/sh
#This script collects data from the hive-engine API and puts them into kibana
#Written by Achim Mertens in April 2021
#Follow me on @achimmertens
#Please create, if not exist, the folder /home/pi/elk/$TOKEN/log. I.e.:
#mkdir /home/pi/elk/chary/log
#Set some variables:
TOKEN="chary"
echo "Token = "$TOKEN
DATE=date -I
echo "DATE = "$DATE
LOGPATH="/home/pi/elk/$TOKEN/log"
echo "LOGPATH = "$LOGPATH
LOG="$LOGPATH/$TOKEN""curl.log"
echo "LOG = "$LOG
LOG1="$LOGPATH/$TOKEN""curl1.log"
echo "LOG1 = "$LOG1
LOG2="$LOGPATH/$TOKEN""curl2.log"
echo "LOG2 = "$LOG2
LOG3="$LOGPATH/$TOKEN""curl3.log"
echo "LOG3 = "$LOG3
LOGDATE="$LOGPATH/$TOKEN""curl_$DATE.log"
echo "LOGDATE = "$LOGDATE
LOGCONS="$LOGPATH/$TOKEN""curlcons.log"
echo "LOGCONS = "$LOGCONS
LOGCONSUNIQTEMP="$LOGPATH/$TOKEN""curlconsuniqtemp.log"
echo "LOGCONSUNIQ = "$LOGCONSUNIQTEMP
LOGCONSUNIQ="$LOGPATH/$TOKEN""curlconsuniq.log"
echo "LOGCONSUNIQ = "$LOGCONSUNIQ
INDEXLOG="$LOGPATH/$TOKEN"_ids.log
echo "INDEXLOG = "$INDEXLOG
INDEXLOG2="$LOGPATH/$TOKEN"_ids2.log
echo "INDEXLOG2 = "$INDEXLOG2
INDEXLOG3="$LOGPATH/$TOKEN"_ids3.log
echo "INDEXLOG3 = "$INDEXLOG3
#Get json file from api engine:
curl -XPOST -H "Content-type: application/json" -d '{ "jsonrpc": "2.0", "method": "find", "params": { "contract": "market", "table": "tradesHistory", "query": { "symbol": "CHARY"}, "limit":1000, "offset": 0 }, "id": 1 }' 'https://api.hive-engine.com/rpc/contracts' > $LOG
cat $LOG | sed -r 's/^.{34}//' | sed 's/.{3}$//' > $LOG1 # delete the first 34 and the last 3 characters
sed s/_id/id/g $LOG1 | sed s/},{"id"/={"id"/g | tr "=" "\n" > $LOG2 # exchange "id" and insert newlines
sed s/$/}/g $LOG2 > $LOG3 # Append } at the end of each line
#By extracting the IDs and setting it to the field "_id", we make sure, that all entires are unique:
cat $LOG3 | awk -F':' '{print $2}'| awk -F',' '{print $1}' | grep -v index > $INDEXLOG # Extrahiere IDs
cat $INDEXLOG | awk '{print "{"index": {"_index":"chary","_id":"" $1 ""}}="'} > $INDEXLOG2 # Füge Text ein
paste $INDEXLOG2 $LOG3 > $INDEXLOG3
sed s/=/=/g $INDEXLOG3 | tr "=" "\n" > $LOGDATE # Ersetze "=" durch Cariege Return
cat $LOGDATE >> $LOGCONS # Sammle die Daten in einem Topf
#Upload the complete json data into kibana:
curl --location --request POST 'http://localhost:9200/chary/_bulk?' --header 'Content-Type: application/json' --data-binary @$LOGDATE
(It was a bit changed in the markup language, so I created this screenshot):
After executing it looks like this:
Now this script has to run regularely. This is done with crontab. Meanwhile I have several scripts. They start every morning at 4:50, 4:51, 4:52,...:
crontab -e
#m h dom mon dow command
50 4 * * * /home/pi/chary/charycurl.sh >> /home/pi/chary/cron.log
51 4 * * * /home/pi/elk/beer/beercurl_json.sh >> /home/pi/elk/beer/log/cron.log
52 4 * * * /home/pi/elk/chary/charycurl_json.sh >> /home/pi/elk/chary/log/cron.log
53 4 * * * /home/pi/elk/pob/pobcurl_json.sh >> /home/pi/elk/pob/log/cron.log
54 4 * * * /home/pi/elk/list/listcurl_json.sh >> /home/pi/elk/list/log/cron.log
A cron.log looks like this:
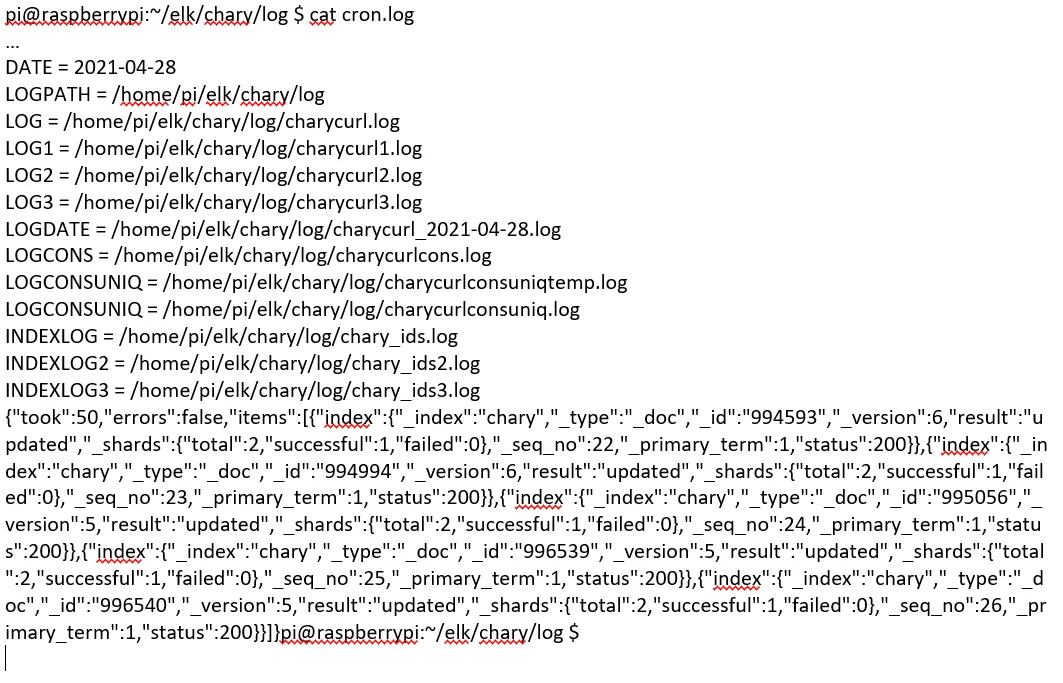
Preparing Kibana
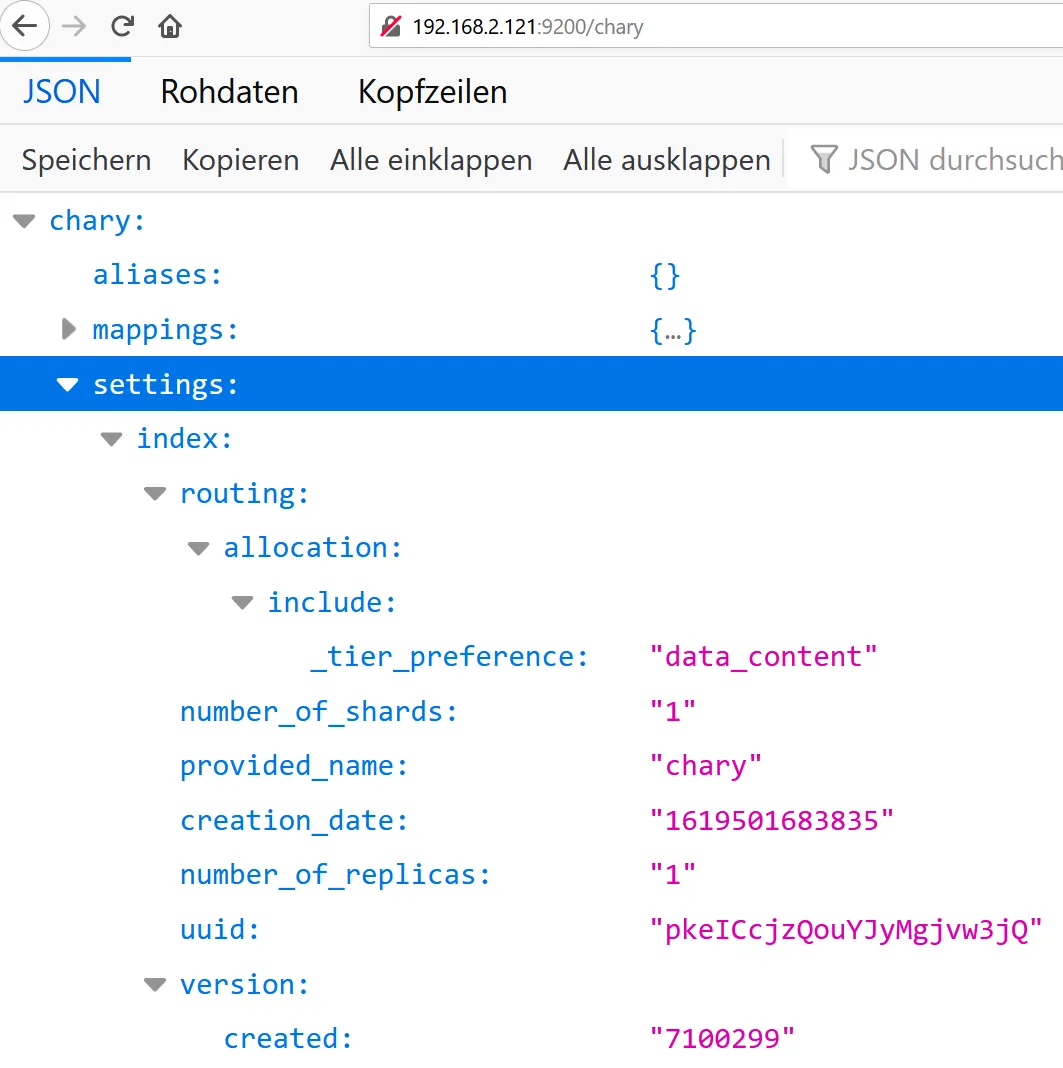
Now the first bulkload was done to Elasticsearch/Kibana. One can test it via port 9200 (Elasticsearch):
http://192.168.2.121:9200/chary
The result should look like this:
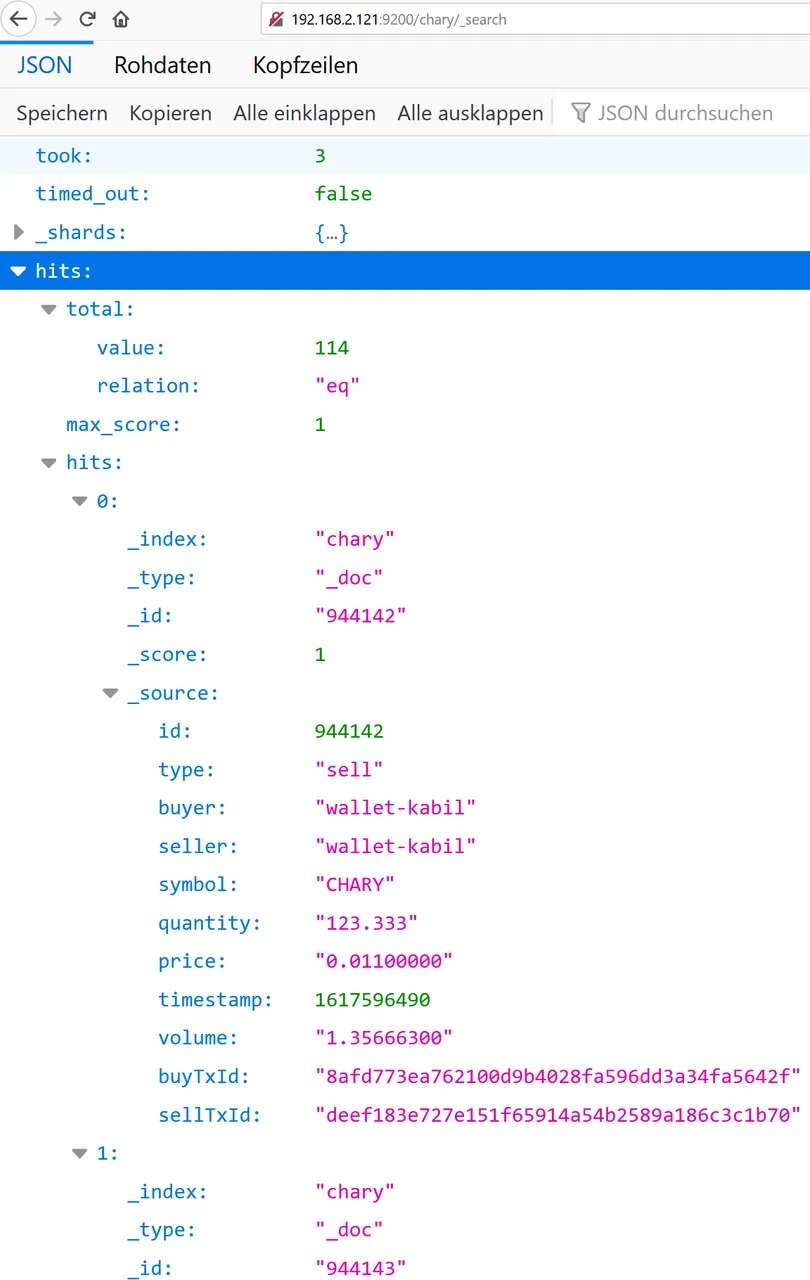
Here is the first data set:
http://192.168.2.121:9200/chary/_search
Mapping
In Kibana we now have the hen-egg problem. We need a proper index with a proper mapping, which we don't have at the beginning. The easiest way is to import the first bulkload, which gives us a rough mapping. Then we can copy the index, delete, paste and modify it, and put it back. This can be done with the dev-tools of kibana:
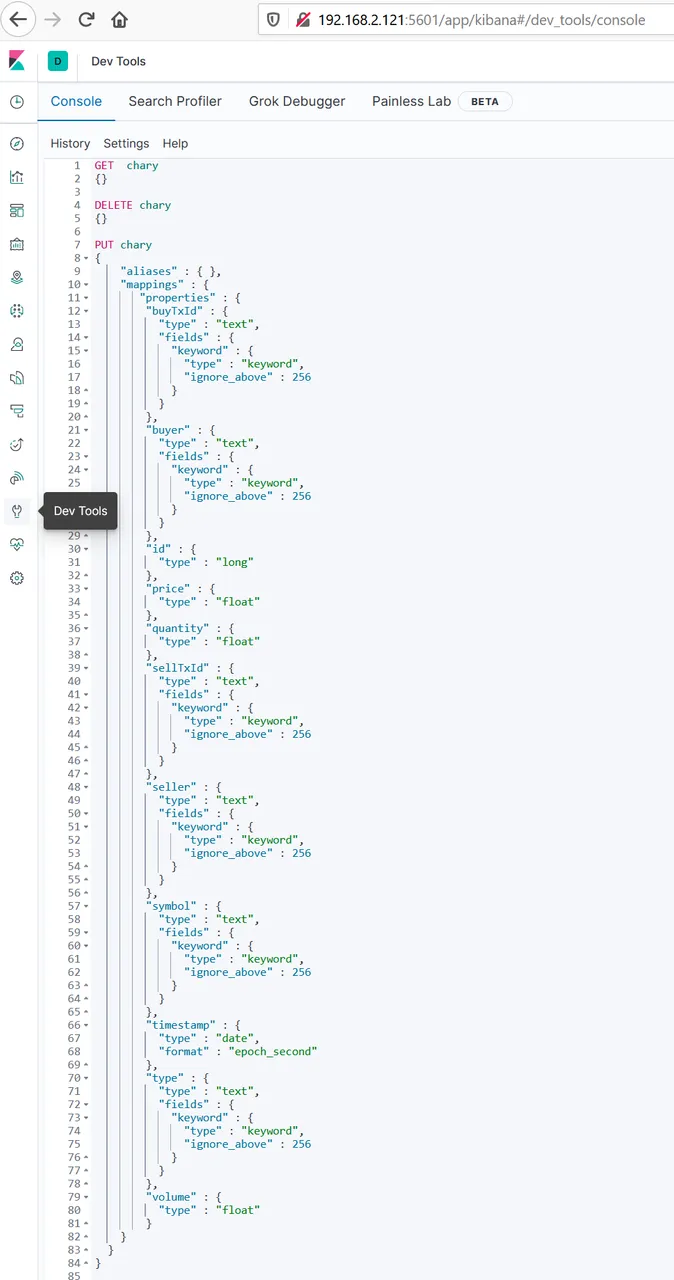
Especially the time format had to be exchanged, otherwise we don't find the data at the right point.
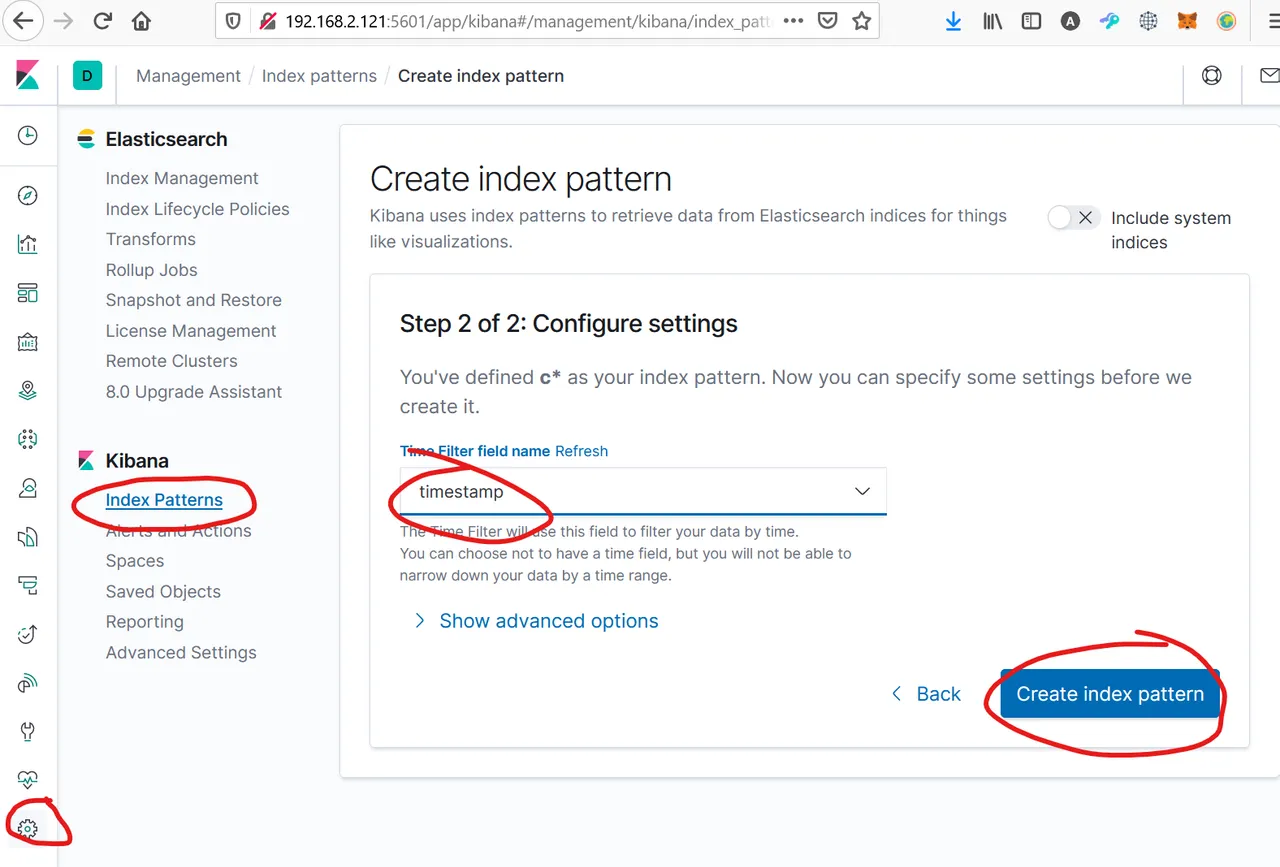
Creating an Index Pattern
In Kibana (port 5601), we have to create an index pattern, based on the index "chary", which was created during the bulk load. We need this pattern for creating our reports. This is set up easy via "Create index pattern" and choosing the timestamp:
Now we should be able to see our first results (maybe you have to import once again, because after deleting the index, all data disapears). Go to discover, choose your index pattern and be aware of the right timeframe:
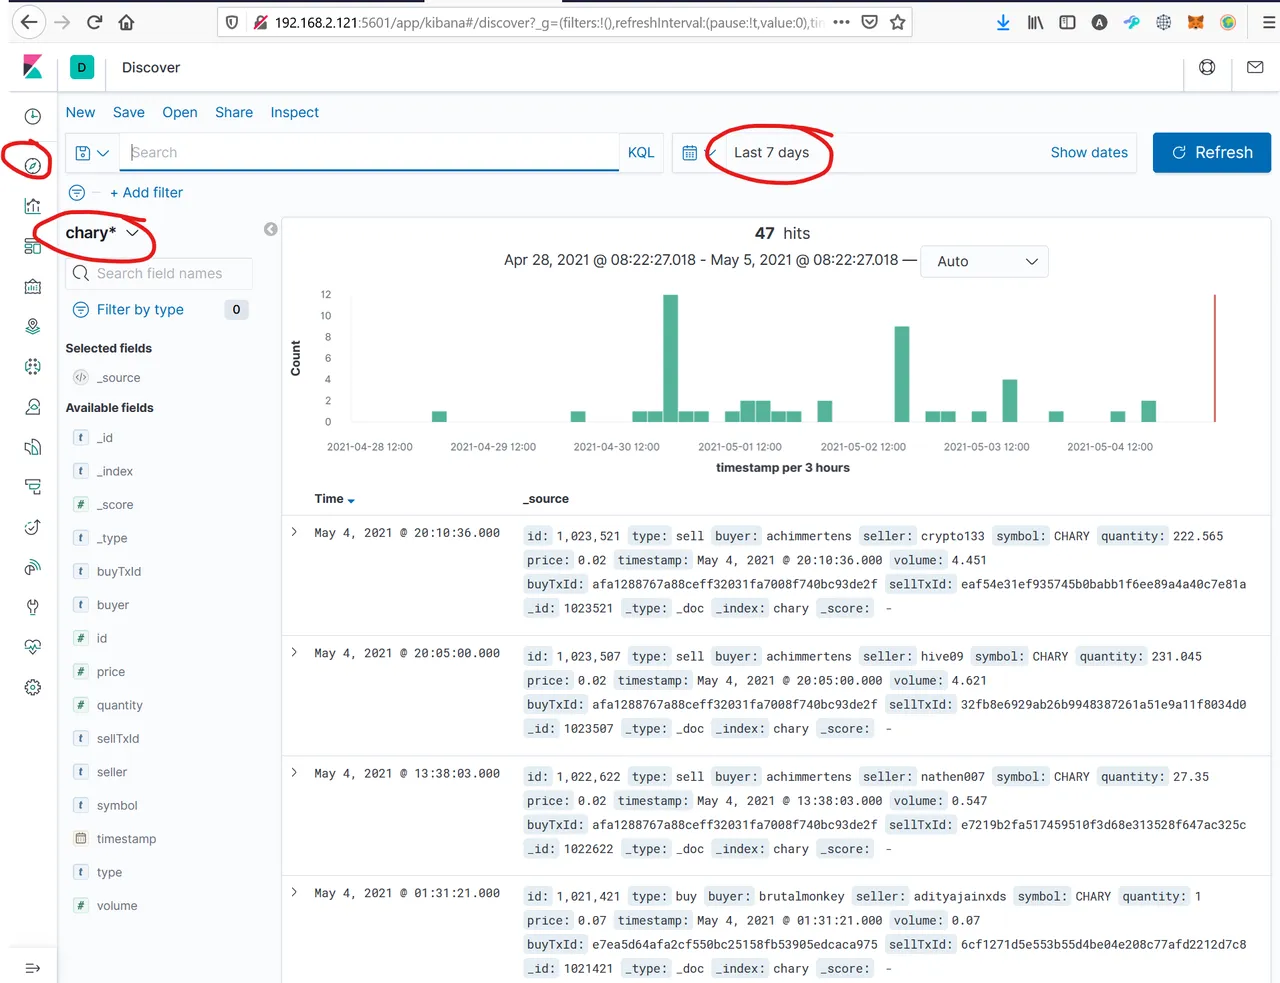
Please check if all data is in the format you need. (Text = text, number = numbers,...) otherwise you cannot create the wished reports. If they are wrong, go back to the mapping section.
Reports
Now we can start with preparing our figures. Go to visualize and create your first visualization:
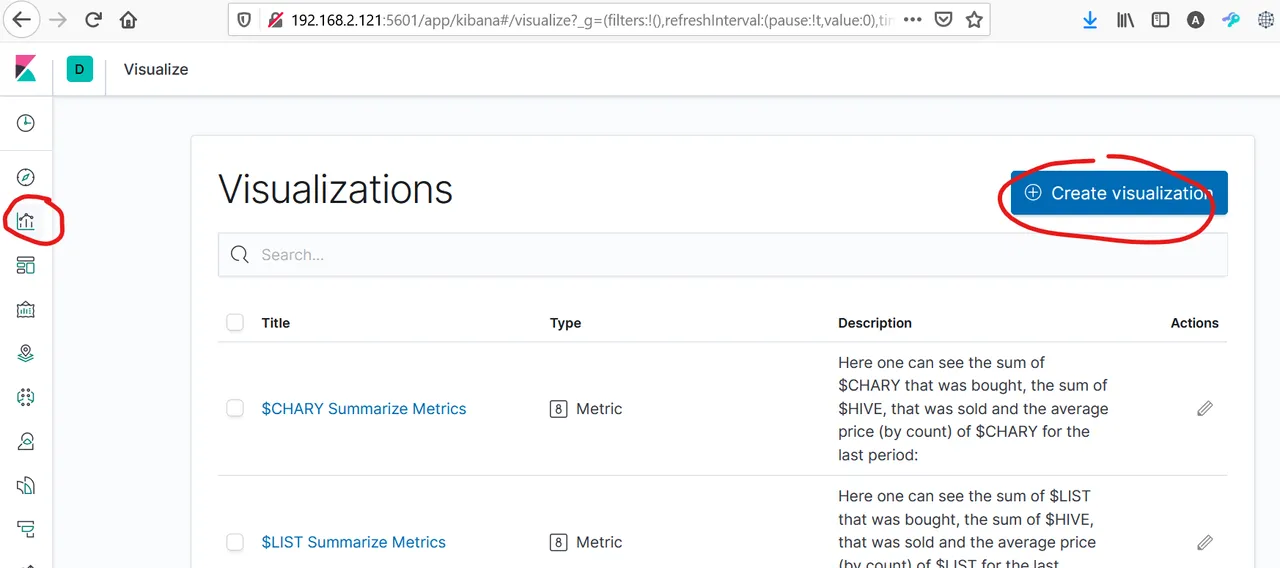
In this post I already have written about how one can do it.
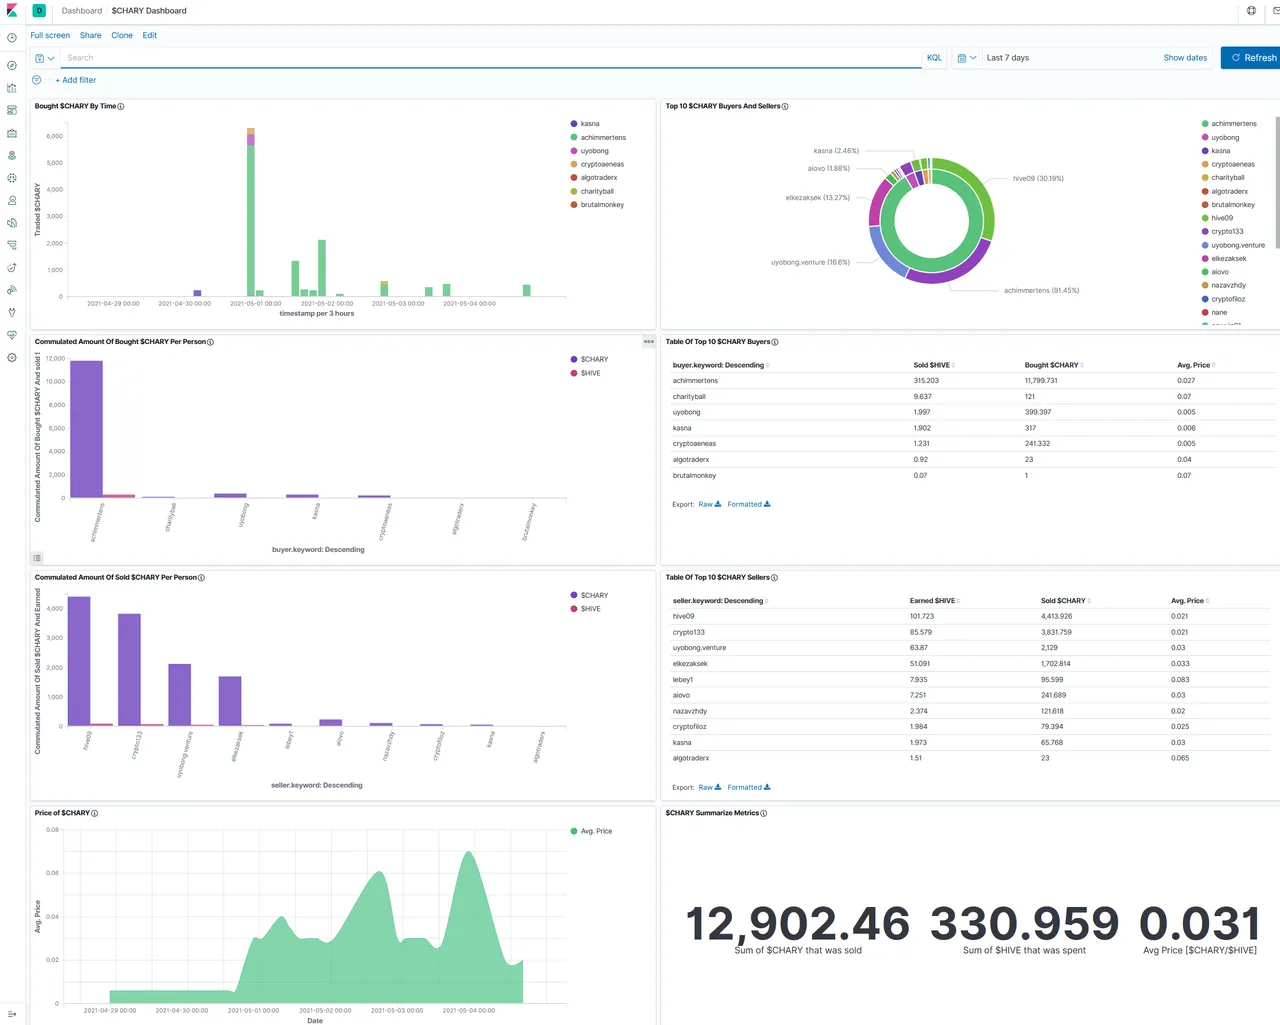
After that, create (if you want) a dashboard, where you bring in you favorite visualizations:
Sum up
It took me several month (with about 5 hours peer week) to come here. For me it was a walk through a djungle maze with lot of swamps, where I got stuck, because I started with nothing but some basic know how. But I had some clear goals: I wanted to understand how API works, how ELK works and to create a report for my $CHARY token. I need this knowledge also for my job.
Now I am not an expert, but I understand the basic concepts. And I have reached my goal. This is a cool feeling.

In the next days I want to show you, what I do, if someone asks "Can you also monitor the XYZ token?"
If you have questions, please ask me.
Regards, Achim
See here the followed post: do-you-want-to-see-statistics-of-your-favorite-hive-token