[Image 1]
Introduction
Hey it's a me again @drifter1! Today we continue with Physics and more specifically the branch "Classical Mechanics" to talk about Potential Energy Diagrams.
More specifcally, today's topics are:
- Energy Diagram Interpretation/Meaning
- Steps to draw an Energy Diagram
- Energy Diagram Example and Explanation
So, without further ado, let's get straight into them!
Energy Diagram Interpretation/Meaning
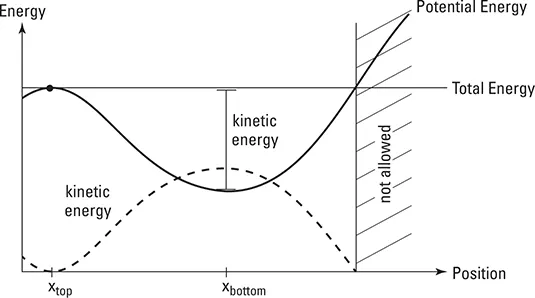
As we know from previous articles, the potential energy is dependent of an object's position. Getting higher for example increases our potential energy, whilst getting down decreases it. So, what exactly is an energy diagram? Well, it's an diagram that shows us how the potential energy of a moving object changes while it's position changes. More specifically, interpreting the diagram in the beginning of the post (where an object rolls down a hill and up again) we can say that the gravitational potential energy is at it's highest value on top of the hill. In the same way, we can also say that the potential energy has the lowest value at the bottom of the hill. Getting down the hill the potential energy changes into kinetic energy, preserving the energy and so keeping the total energy sum at a constant value. Of course, in this case we are talking about a friction-less environment.So, the things that you should always take into account are:
- The total energy doesn't change when there's no friction. In this case the kinetic energy is equal to K = E - U >= 0.
- An object changes direction (turns around) at the point where the total energy line and potential energy curve cross.
- Starting an object from a different location (different initial potential energy) or with a different initial kinetic energy, we of course also change the total energy (E = K + U), causing the total energy line to shift up or down.
- An object can never be at a location where the potential energy is higher than the total energy. In that case the potential energy curve would be above the total energy line. Of course there's no negative kinetic energy. Also don't confuse it with negative velocity! Negative velocity is just showing us that an object moves in the other direction. The kinetic energy (K = 1/2mv^2) is always positive!
- To lower or increase the potential energy of an object, by moving it to a new location, you have to apply a force towards that new location (for example gravity moves an object down a hill).
Steps to draw an Energy Diagram
So, how exactly do we draw such an energy diagram? Well, the best way is to follow specific steps:- Identify the points of interest where you have to draw the diagram for. You simply include the points where information about the situation is given and/or values are asked to solve for.
- Identify the types of energy that are involved. (linear or rotational kinetic energy, various potential energy types, internal energy and more...)
- Draw bar charts for each point of interest or a complete graph of energy and position for the complete motion, getting more specific about the specific points of interest.
- Using the diagrams, write down the sum of all energies at each point of interest, setting those of different points of interest equal to each other (energy conservation).
So, in the end you will end up with diagrams such as:

[Image 2]
Energy Diagram Example and Explanation
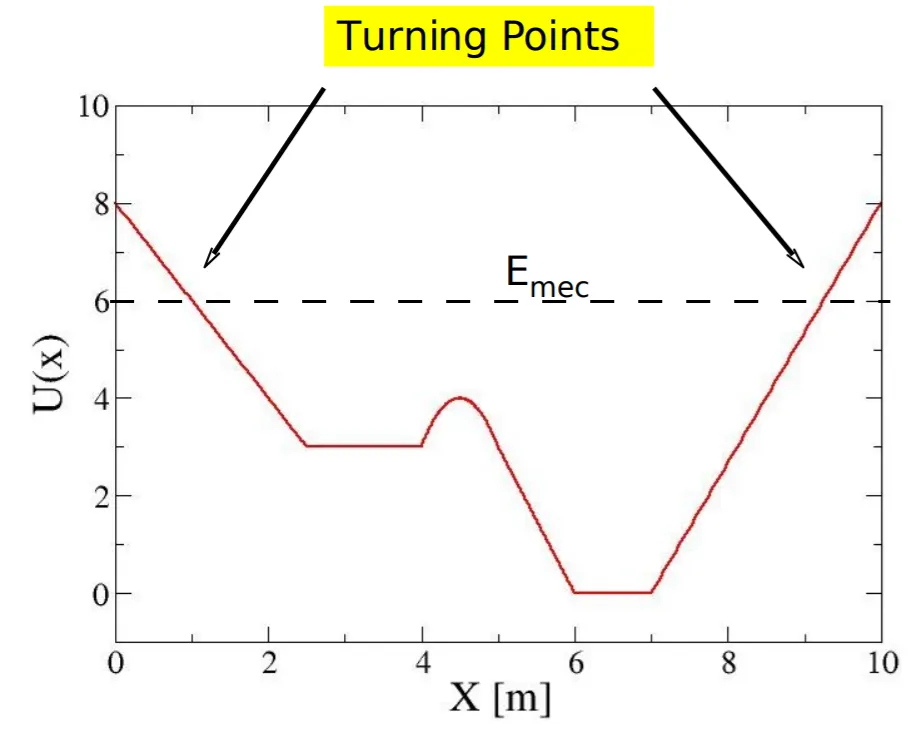
Consider the following diagram from phys.ufl.edu:
[Image 3]
Let's consider that we release an object of mass m = 1Kg at x = 4.5m with an initial kinetic energy of 2J. Answer the following:- How large is the Force F(x) = -dU/dx? When is it positive and when negative?
- Calculate the speed of the object at x = 3m and x = 6m.
- Where are the turning points?
1.
Thinking about what we talked about previously we clearly understand that negative force will pull the object down (lower x), whilst positive force will push it upwards (higher x). Being the first derivative of the potential energy U(x), we end up with the following force F(x):
[Image 4]
2.
At the starting point of 4.5m the potential energy is 4J. Therefore, the total energy of the object is:
At x = 3m the potential energy is U = 3J. The total energy is being conserved and so the kinetic energy is:

Applying the kinetic energy formula we can get the velocity:
 In the same way at x = 6m, the potential energy is U = 0J, meaning that K = E - U = 6 - 0 = 6J and so the velocity is:
3.
Turning points are the points where the potential energy curve crosses over the total energy line. Knowing that the total energy is 6J, in our case, the turning points are at around x = 1m and x = 9m and so at:
[Image 5]
RESOURCES:
References
- https://www.dummies.com/education/science/physics/how-to-interpret-energy-diagrams-in-physics/
- http://physics.wku.edu/phys201/Information/ProblemSolving/EnergyDiagrams.html
- http://www.phys.ufl.edu/~mueller/PHY2048/2048_Chapter8_F08_Part3.pdf
Images
- https://www.dummies.com/education/science/physics/how-to-interpret-energy-diagrams-in-physics/
- http://physics.wku.edu/phys201/Information/ProblemSolving/EnergyDiagrams.html
- http://www.phys.ufl.edu/~mueller/PHY2048/2048_Chapter8_F08_Part3.pdf
Mathematical equations used in this article, where made using quicklatex.
Previous articles of the series
Rectlinear motion
- Velocity and acceleration in a rectlinear motion -> velocity, accelaration and averages of those
- Rectlinear motion with constant accelaration and free falling -> const accelaration motion and free fall
- Rectlinear motion with variable acceleration and velocity relativity -> integrations to calculate pos and velocity, relative velocity
- Rectlinear motion exercises -> examples and tasks in rectlinear motion
Plane motion
- Position, velocity and acceleration vectors in a plane motion -> position, velocity and accelaration in plane motion
- Projectile motion as a plane motion -> missile/bullet motion as a plane motion
- Smooth Circular motion -> smooth circular motion theory
- Plane motion exercises -> examples and tasks in plane motions
Newton's laws and Applications
- Force and Newton's first law -> force, 1st law
- Mass and Newton's second law -> mass, 2nd law
- Newton's 3rd law and mass vs weight -> mass vs weight, 3rd law, friction
- Applying Newton's Laws -> free-body diagram, point equilibrium and 2nd law applications
- Contact forces and friction -> contact force, friction
- Dynamics of Circular motion -> circular motion dynamics, applications
- Object equilibrium and 2nd law application examples -> examples of object equilibrium and 2nd law applications
- Contact force and friction examples -> exercises in force and friction
- Circular dynamic and vertical circle motion examples -> exercises in circular dynamics
- Advanced Newton law examples -> advanced (more difficult) exercises
Work and Energy
- Work and Kinetic Energy -> Definition of Work, Work by a constant and variable Force, Work and Kinetic Energy, Power, Exercises
- Conservative and Non-Conservative Forces -> Conservation of Energy, Conservative and Non-Conservative Forces and Fields, Calculations and Exercises
- Potential and Mechanical Energy -> Gravitational and Elastic Potential Energy, Conservation of Mechanical Energy, Problem Solving Strategy & Tips
- Force and Potential Energy -> Force as Energy Derivative (1-dim) and Gradient (3-dim)
Final words | Next up
This is actually it for today's post! Next time we will continue with Internal Work and Energy.
See ya!


Keep on drifting!
