For a while I have been meaning to try getting some crypto price data to play with. Some time ago I did some coding with Coinmarketcap, but I tend to use @coingecko for my prices these days. They have an API that is free to use and does not even require you to have an API key. My programming language of choice is Python and they have a library for that.
I am using Python 3.8.5 on Ubuntu Linux. Installing the library was as simple as:
pip install pycoingecko
For general playing around I tend to work in Jupyter Notebooks as this is fairly interactive and you can run little pieces of code at a time.
You access the API by creating an API object. I am loading a couple of other libraries I needed:
import matplotlib.pyplot as plt
from datetime import datetime

from pycoingecko import CoinGeckoAPI
cg = CoinGeckoAPI()
Getting prices is pretty simple. You need to list the coins and the currencies you want. Lists of the names of these can be obtained using other functions.
cg.get_price(ids='hive,steem',vs_currencies='usd,btc',include_market_cap='true')
This gives you a dictionary of values. You can extract the individual values easily.
{'steem': {'usd': 0.706357,
'usd_market_cap': 274169195.78568745,
'btc': 1.369e-05,
'btc_market_cap': 5308.488493606708},
'hive': {'usd': 0.788722,
'usd_market_cap': 287945892.6830051,
'btc': 1.529e-05,
'btc_market_cap': 5575.234131276685}}
Getting values over time is also simple. This gives you lists of price, market cap and volume.
hivemc = cg.get_coin_market_chart_by_id(id='hive', vs_currency='usd', days=90)
steemmc = cg.get_coin_market_chart_by_id(id='steem', vs_currency='usd', days=90)
maptplotlib is a powerful plotting library with loads of options, but I am keeping it fairly simple for now. The tricky bit was getting usable dates. The timestamp seems to be a Unix one in milliseconds, so a little conversion was required.
fig, ax = plt.subplots()
fig.set_size_inches(8,6)
ax.plot([datetime.utcfromtimestamp(x[0]/1000) for x in hivemc['prices']],
        [x[1] for x in hivemc['prices']], label='HIVE')
ax.plot([datetime.utcfromtimestamp(x[0]/1000) for x in steemmc['prices'] ],
        [x[1] for x in steemmc['prices']], label='STEEM')
ax.set_xlabel('Hours')
ax.set_ylabel('Price *US$)')
ax.legend();
That gives this graph (that makes me happy in more ways than one):
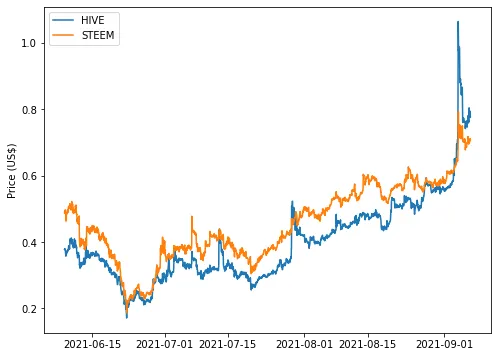
There are lots of ways you can customise this. With a little work you could reproduce the sort of charts you see on the Coingecko website or elsewhere online.
Ages ago I did a price ticker with a Raspberry Pi Zero and a matrix display. I am tempted to revive that to show me the $HIVE price.