Histogram
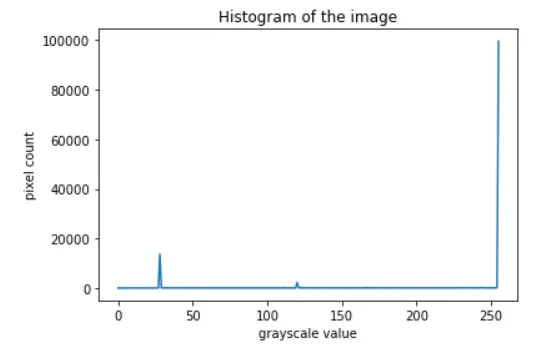
Histogram is a graphical representation of the intensity distribution of an image. In simple terms, it represents the number of pixels for each intensity value considered.
Histogram equalization is a method in image processing of contrast adjustment using the image’s histogram. This method usually increases the global contrast of many images, especially when the usable data of the image is represented by close contrast values. Through this adjustment, the intensities can be better distributed on the histogram. This allows for areas of lower local contrast to gain a higher contrast. Histogram equalization accomplishes this by effectively spreading out the most frequent intensity values. The method is useful in images with backgrounds and foregrounds that are both bright or both dark. OpenCV has a function to do this, cv2.equalizeHist(). Its input is just grayscale image and output is our histogram equalized image.
Tools Used: Jupyter NoteBook
Python Libraries: OpenCV, numpy, matplotlib
Program:
import cv2
import numpy as np
import matplotlib.pyplot as plt
read a image using imread
image = cv2.imread('D:\Pictures\BiggestLoser.png')
image = cv2.cvtColor(image,cv2.COLOR_BGR2RGB)
to show the original image
plt.title('Original image')
plt.imshow(image);
Converting the original image to grayscale
gray_image = cv2.cvtColor(image, cv2.COLOR_BGR2GRAY)
to show grey scale image
plt.title('Grayscale image')
plt.imshow(gray_image, cmap='gray', vmin = 0, vmax = 255);
find frequency of pixels in range 0d frequency of pixels in range 0--255255
histr = cv2.calcHist([gray_image],[0],None,[256],[0,256])
plotting histogram
plt.title('Histogram of the image')
plt.xlabel('grayscale value')
plt.ylabel('pixel count')
plt.plot(histr)
plt.show()
creating a Histograms Equalization of a of a image using cv2.equalizeHist()
equal = cv2.equalizeHist(gray_image)
stacking images side
result = np.hstack((gray_image, equal))
show image input vs output
cv2.imshow('BiggestLoserImage', result)
cv2.waitKey(0)
cv2.destroyAllWindows()

Explanation:
- Three Python Libraries OpenCv, numpy and matplotlib are used so we have to import it in the program.
- Matplotlib.pyplot is used to plot the histogram and display the original/grayscale image.
- The original image is converted to grayscale for histogram equalization.
- Imread function of OpenCv is used for reading the image and in it the path of the image and the flag value (0 which is for grayscale) is given.
- calcHist() function of OpenCv is used to calculate the histogram of the grayscale image. It contains various attributes: images : it is the source image of type uint8 or float32 represented as “[img]”. channels : it is the index of channel for which we calculate histogram. For grayscale image, its value is [0] and color image, you can pass [0], [1] or [2] to calculate histogram of blue, green or red channel respectively. mask : mask image. To find histogram of full image, it is given as “None”. histSize : this represents our BIN count. For full scale, we pass [256]. ranges : this is our RANGE. Normally, it is [0,256]
- We use the equalizeHist function of OpenCV which takes the greyscale image and converts to histogram equalized image.
- We use the hstack() function of the numpy to stack the sequence of input arrays horizontally (i.e. column wise) to make a single array.
- We use imshow method of OpenCV to display an image in a window. The window automatically fits to the image size.
- waitKey() will pause the screen and destroyAllWindows() will close all the windows if multiple windows are open.
References: wikipedia, personal prepared notes
Reference 1 Reference 2
I tried to make the code simple to understand and gave explanation of the various functions used in the program. Feel free to give your suggestions. Until we meet again in some other post, this is @biggestloser signing off....