DASHUSDT 4 hours time frame.If the trade break the pivot red line on the four hours time frame,is going to reach 264.8 trend line.But DASHUSDT is on bullish trend,it may form a support that will make the trade to get to R1 or down to the pivot line again after getting to 264.8 before it get a strong support that will push it back to R1 or it break the pivot line for bearish trend to activate.
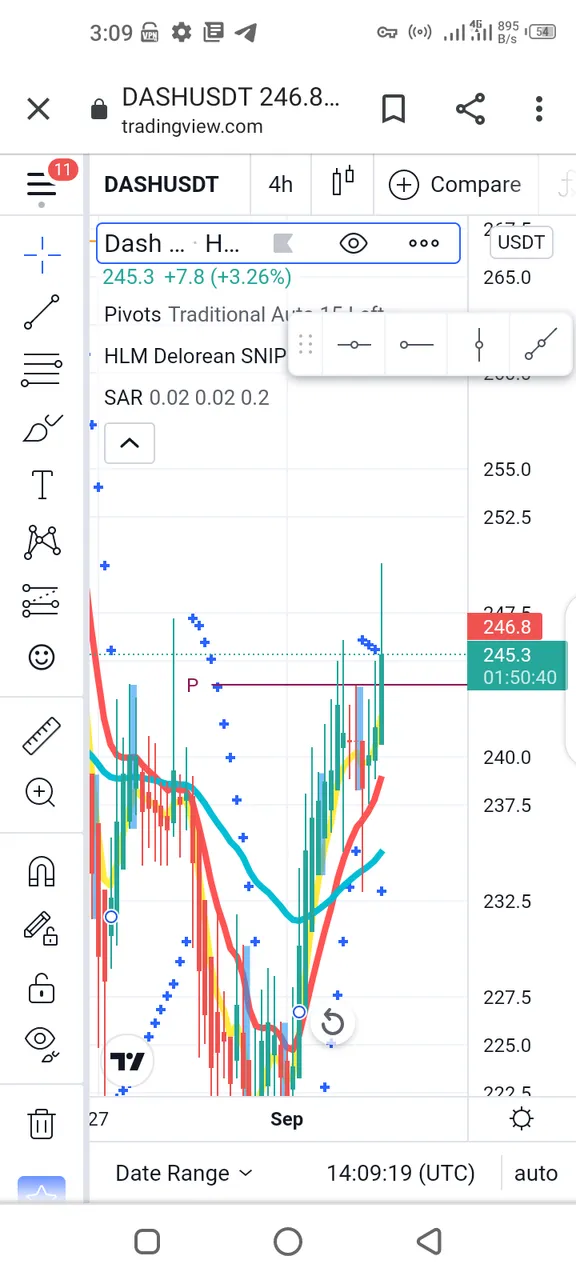
Check your analysis before taking your own trade