Good day Hiveians!
Join me in analyzing the crypto markets!
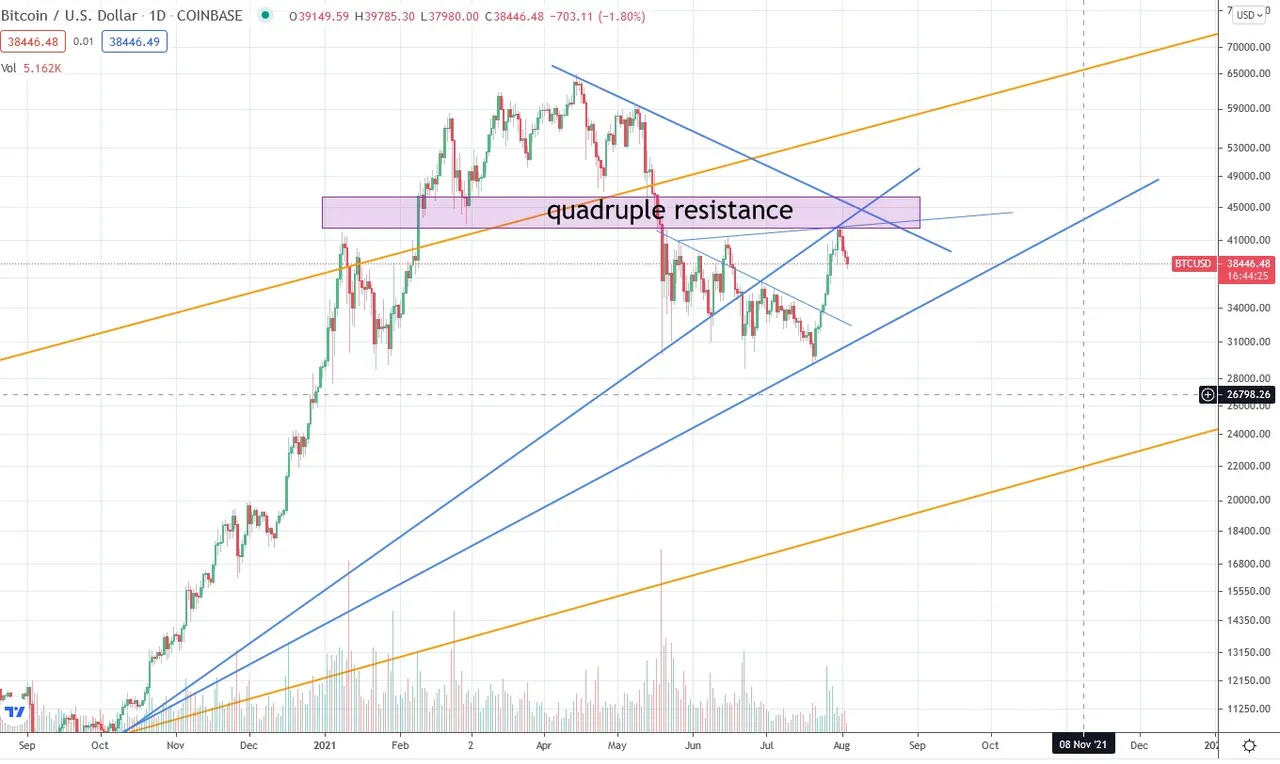
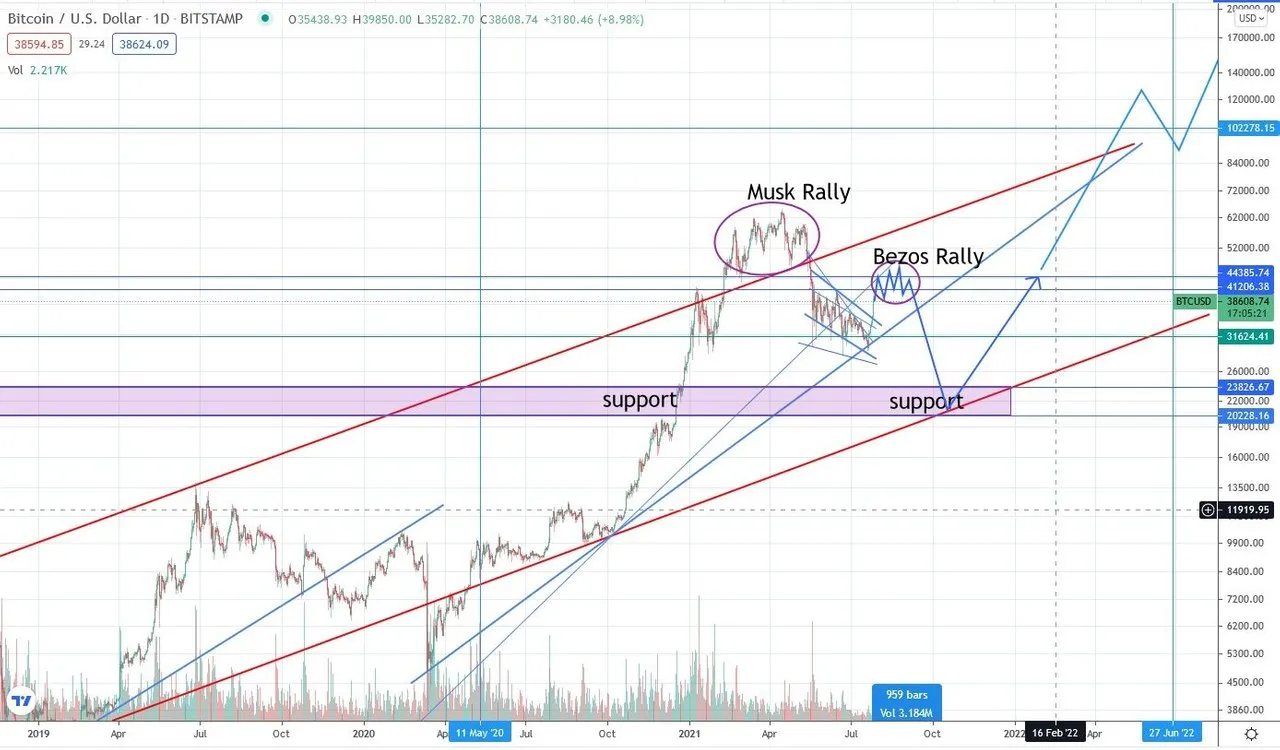
Previously I have argued that BTC would see a lot of resistance at the 40k levels.
So no surprise to see BTC dropping again. But the interesting thing is that the "exact" same thing happened in 2018... and I do mean pretty much the exact same thing. This is now:
And this is from 2018:
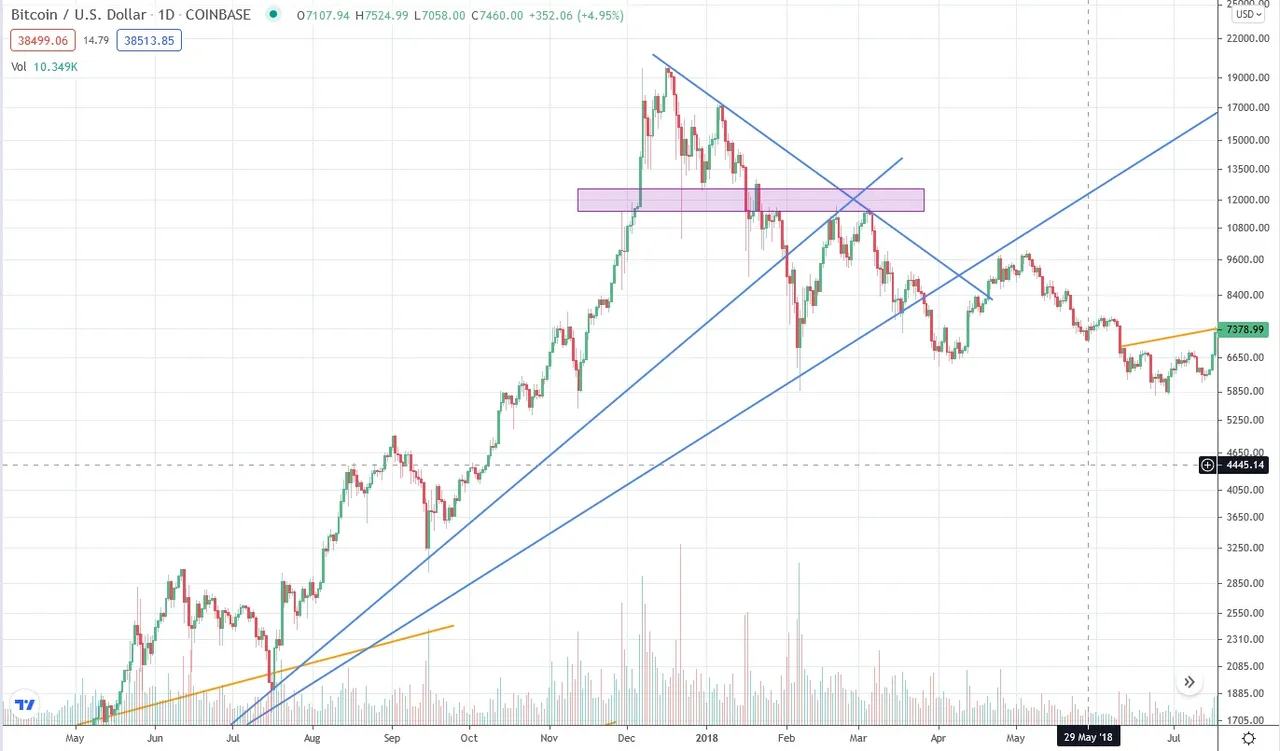
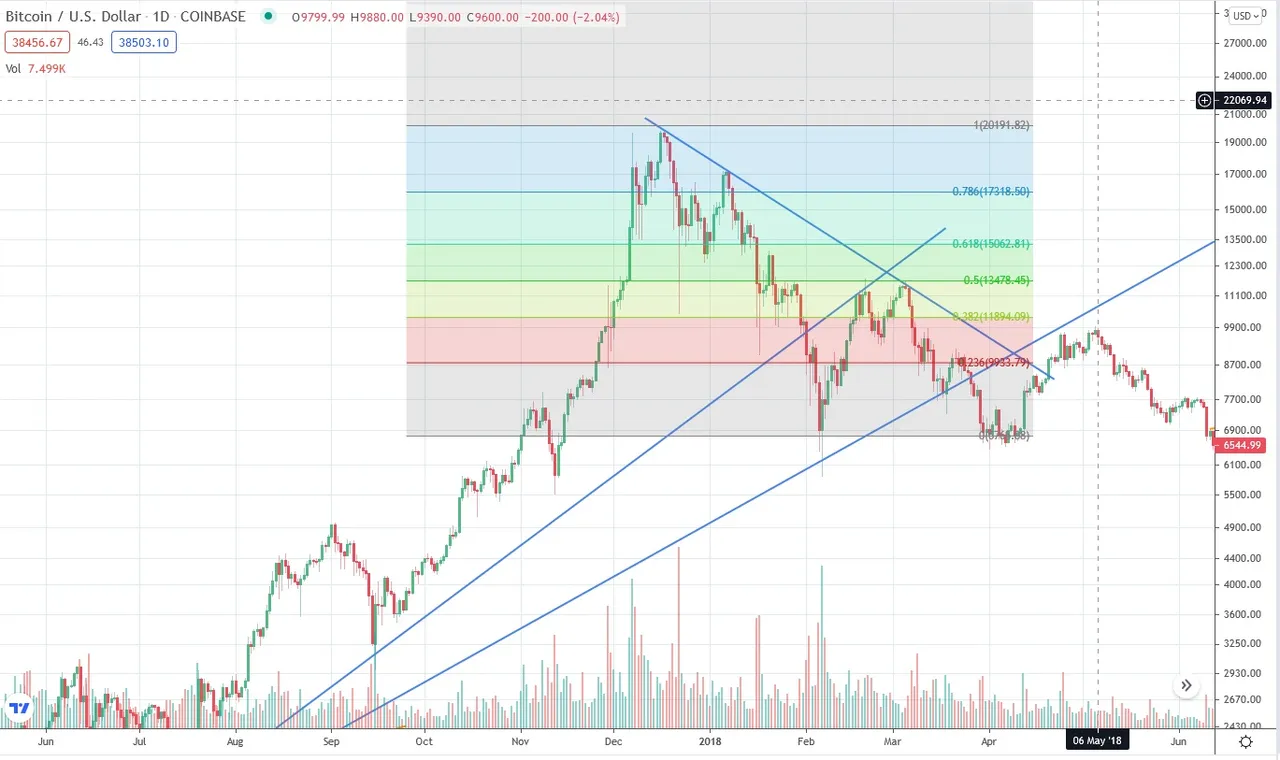
The points I want to emphasize is the trend line coming from the peak to act as a resistance, and the open wedge that price traded in. It is pretty much a one to one copy. But why stop there? The fib channel is also an exact duplicate; notice how price recovers to 0.5 and then after a double peak comes down again
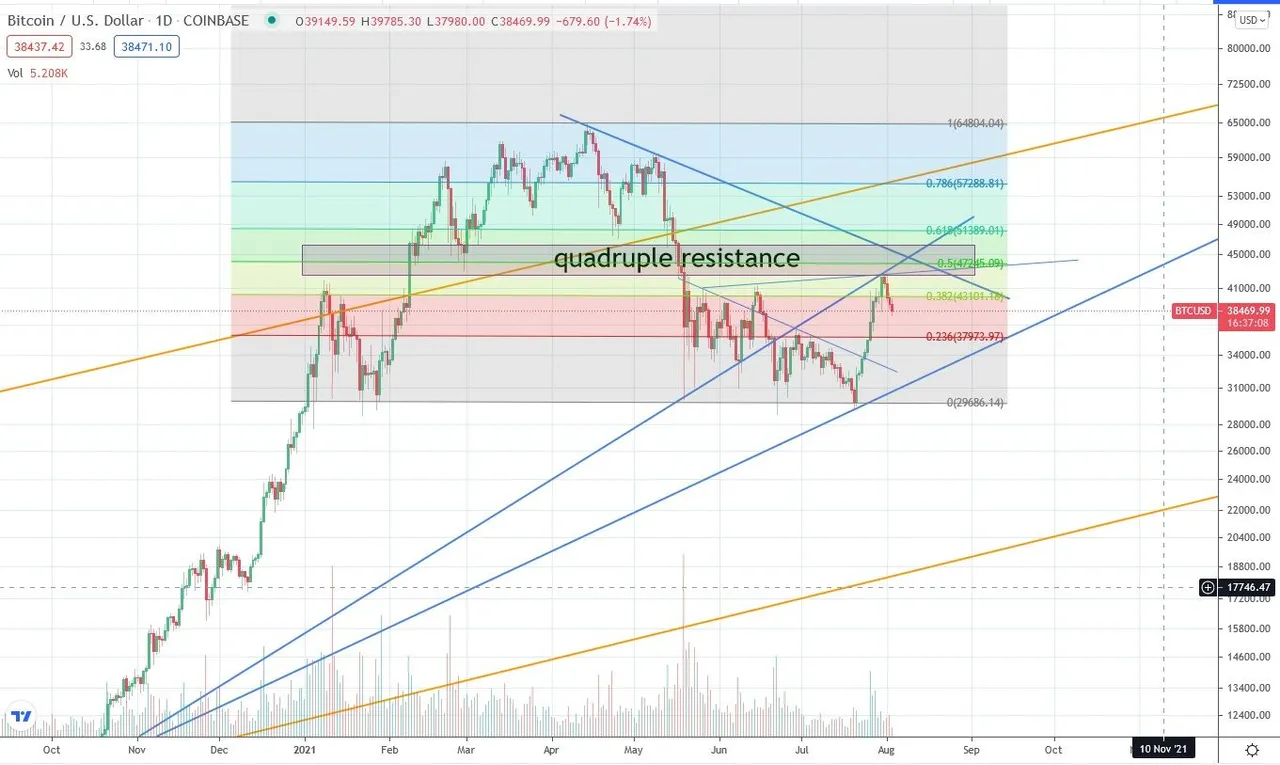
If this is going to repeat (it never does so exactly of course...) then expect another run up to about 42-45k. If price goes beyond the recently establish high of 42k, then there could potentially be a break out to the top (as in 2018 this second peak was lower than the first). However, this is too much of a match for me that I would be betting against a further decline to the 20-30k range. So perhaps short gains and mid term rather large losses?
Seems like we are still on track:
As a general reminder: Please keep in mind that none of this is official investment advice! Crypto trading entails a great deal of risk; never spend money that you can't afford to lose!


Check out the Love The Clouds Community if you share the love for clouds!