These past few days crypto market have been pumping, ATOM and a few others altcoins reach All Time High. Congratulation! Today post, I'm going to share HIVEUSDT Chart🥳. HIVE was one of the altcoins that reached All Time High.
HIVEUSDT Monthly Chart
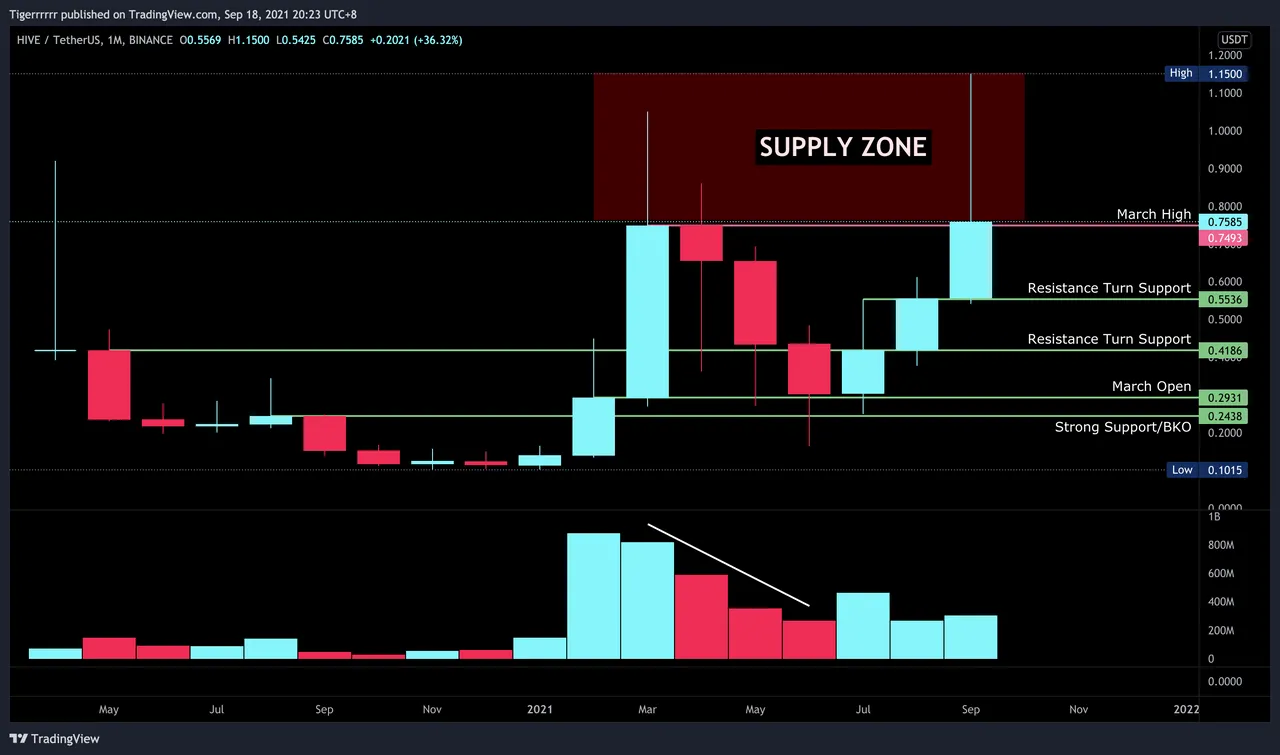
Let start with Hive High Time Frame chart, I choose monthly chart. As you can see, Hive reach All-Time High🥳. The strong support/breakout zone is at $0.2418, touched the support 2 times with a wick down therefore I viewed the zone as a demand zone that have many bids got filled then pushed the price up.
The red rectangle, I viewed it as a supply zone because it is only wick up which also means many sellers are selling pushing down the price. The resistance is at 0.7493, which is also March high based on candle body close. The volume itself look decent though. Will September break the resistance and go higher?
HIVEUSDT Weekly without pattern/clear chart
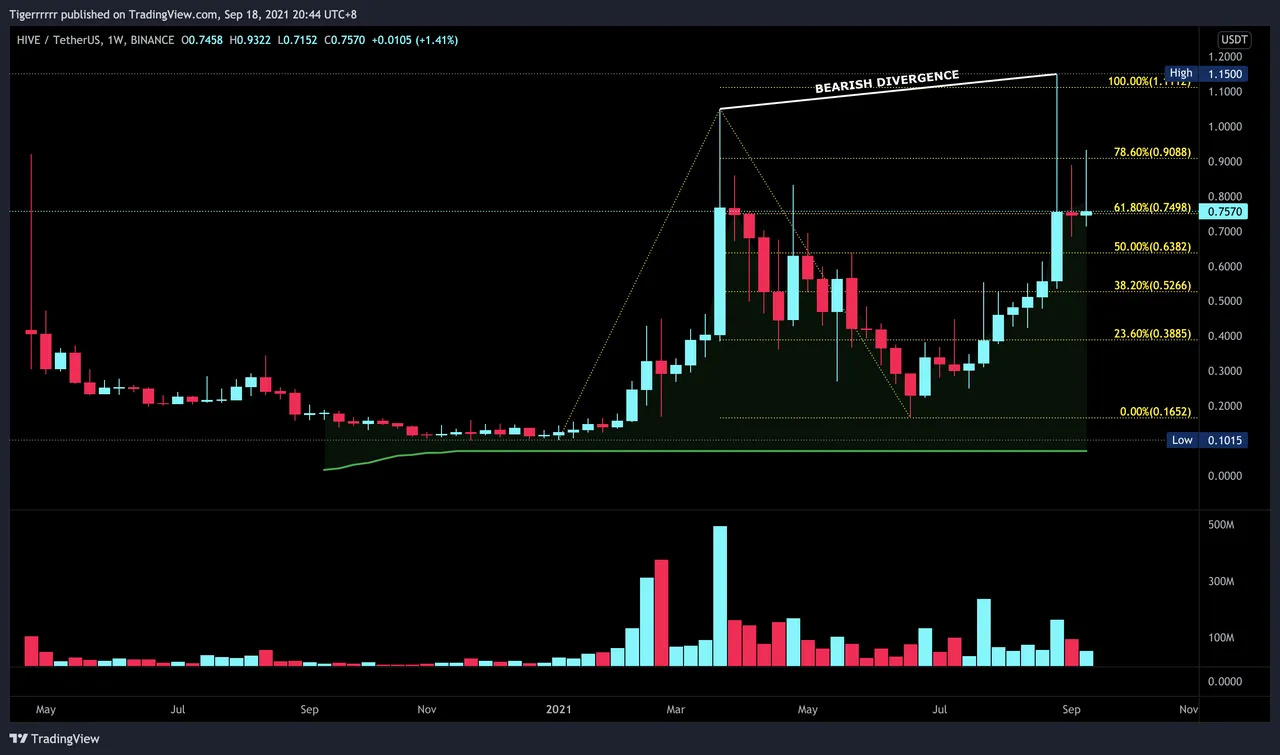
For HIVEUSDT weekly chart, I decided to shared 2 same charts but one without pattern that I draw and one with the pattern that I spotted on the chart. On the weekly HIVEUSDT, there was a Bearish Divergence formed with the indicators I used showed it is still at Buy Signal and a V shape reversal have been fulfilled. The current price sitting at the 61.80%.
HIVEUSDT Weekly Chart
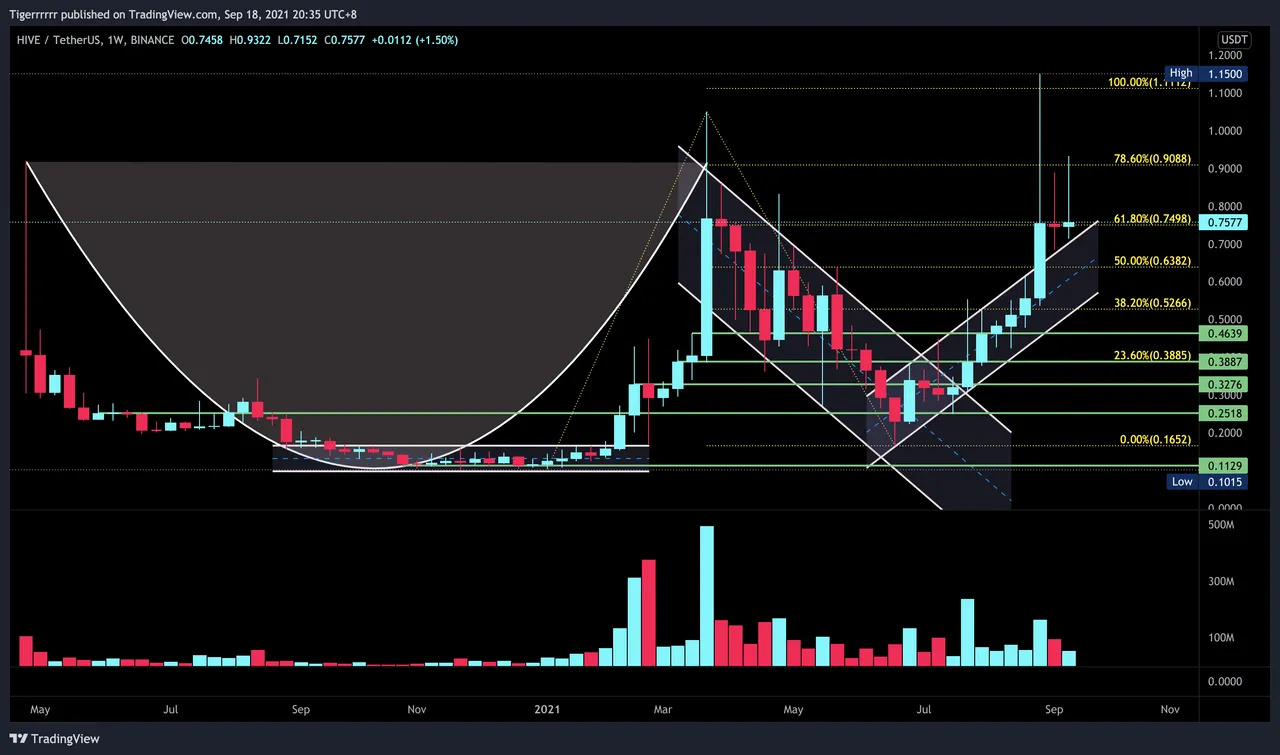
Let look at HIVEUSDT weekly chart that I drew with pattern that I spotted, and there entry can be take too.
- A cup & handle pattern
- Rectangle pattern, price is accumulation/consolidation zone
- Followed by breakout from the rectangle
- Formed a descending channel
- Breakout from the descending channel
- Formed a ascending channel
- and now breakout from the ascending channel
HIVEUSDT Daily Chart
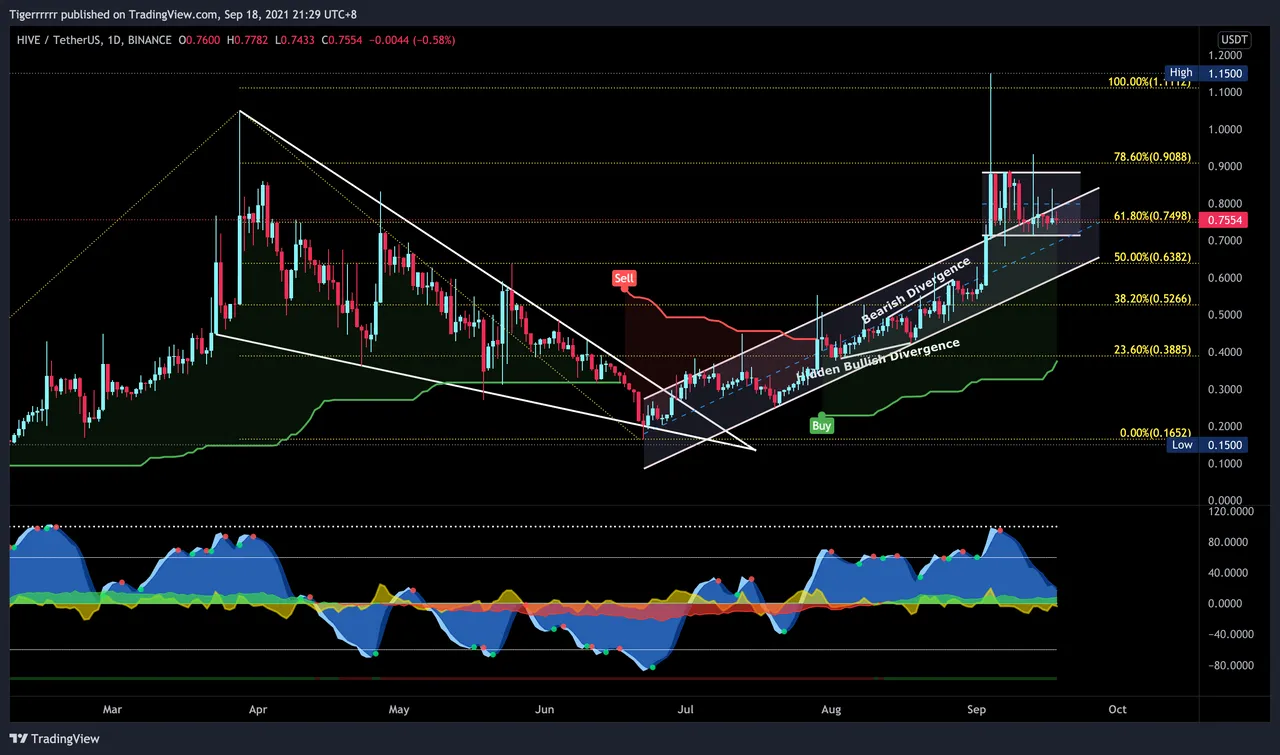
On HIVEUSDT Daily chart, the Sell Signal has turn to Buy Signal for days and the money flow has turn to green too after a few days of Buy Signal. Bullish!
- Falling Wedges
- Breakout from the falling wedges
- Formed a ascending channel
- Inside the ascending channel, there are hidden bullish divergence and bearish divergence
- Breakout from the ascending channel
- And now forming a rectangle
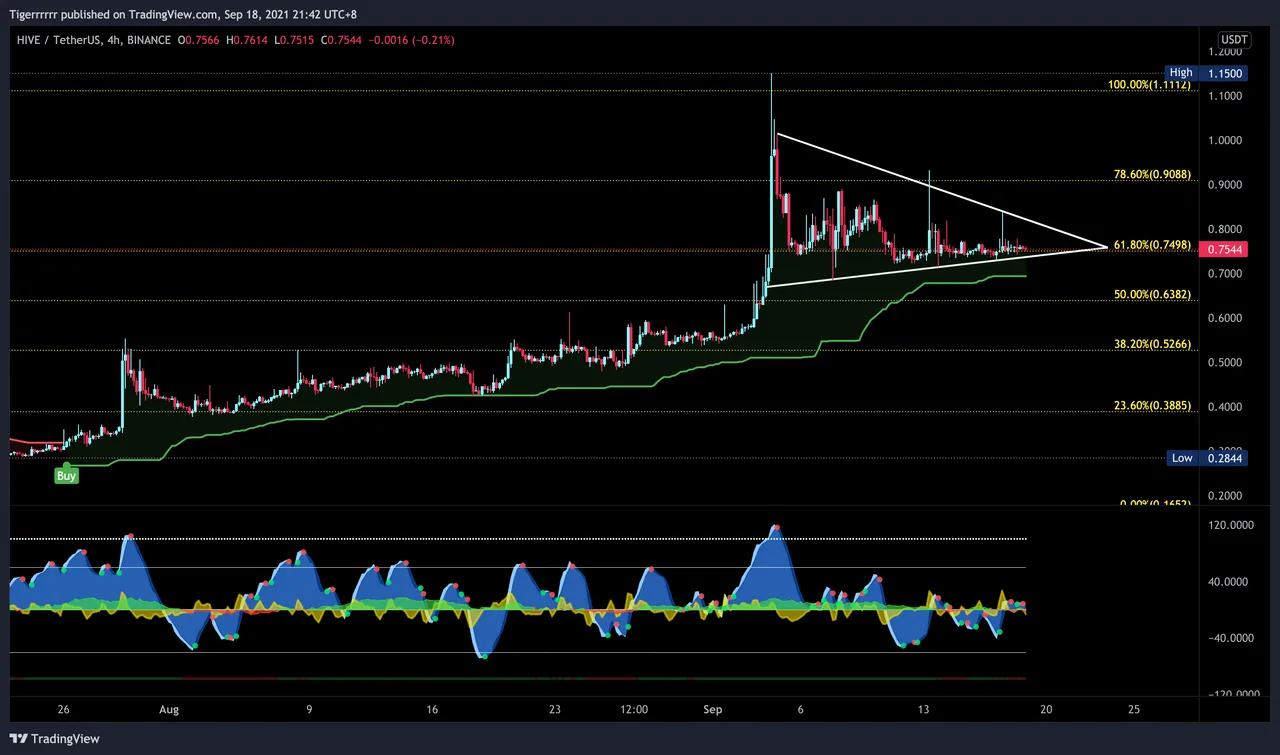
HIVEUSDT 4 Hour Chart
At the 4 hour chart, price seem to be in a consolidation stage and no clear direction where to next.
On a fine afternoon talking to ladyyunajay about trading view functions.. A simple idea pop up!!
Me: Why not we start paper trading at trading view (100K capital, fake money) record it down in a google sheet and share to the world? We can do this as trading exercise and have fun at the same time!
https://docs.google.com/spreadsheets/d/1aogT9AGMsisUbN1ZrfAV0DWeKGy8WWy9uSZ5y3_DT9o/edit#gid=0
Trading is risky and using Leverage to trade is an even higher risk than Spot trade therefore I will suggest you to try out paper trading first before going into Live Trade.
This is just MY PERSONAL OPINION/BIAS/VIEW on the HIVEUSDT chart, 100% NOT FINANCIAL ADVICE & Please Do Your Own Research/Due Diligence. During this pandemic I had started picking up Technical Analysis, doing some small trades and doing my best trying to make ends meet.