Fuente Elaboración Propia
Hola estimada Comunidad Hive - Leo Finance.
El día de hoy quiero compartir un breve y conciso análisis técnico sobre el bitcoin y su precio actual, luego de las medidas restrictivas anunciadas por el gobierno chino, y los vaívenes semánticos de Elon Musk entre el amor y el odio.
Aunque mi área de interés han sido los futuros del índice Nasdaq 100 y los futuros en general (Dow Jones y S&P 500), he venido aprendiendo e informándome cada vez más y más sobre las cryptomonedas.
Aunque cada activo financiero tiene sus particularidades, los principios del análisis técnico aplican a todos ellos, y es un poco lo que aplicaremos hoy.
En particular me interesa saber sobre el bitcoin y el ethereum.
He desarrollado el gráfico que observas a partir de la información y herramientas gráficas gratuitas disponibles en la página Investing.com.
Hello dear Hive Community - Leo Finance.
Today I want to share a brief and concise technical analysis on bitcoin and its current price, after the restrictive measures announced by the Chinese government, and Elon Musk's semantic ups and downs between love and hate.
Although my area of interest has been the Nasdaq 100 index futures and futures in general (Dow Jones and S&P 500), I have been learning and researching more and more about cryptocurrencies.
Although each financial asset has its peculiarities, the principles of technical analysis apply to all of them, and it is a bit what we will apply today.
I am particularly interested in knowing about bitcoin and ethereum.
I have developed the chart you see above from the information and free charting tools available at Investing.com.
¿Es buena idea invertir ahora en bitcoin? / ¿Is it a good idea to invest on bitcoin righ now?

En cuanto al bitcoin, llegó a máximos cercanos a 65.000 $ en abril de 2021 y ciertamente comprar en esos niveles no era una buena idea a mi entender. Ya el mercado había dado un fuerte recorrido y en algún momento iba a corregir a la baja.
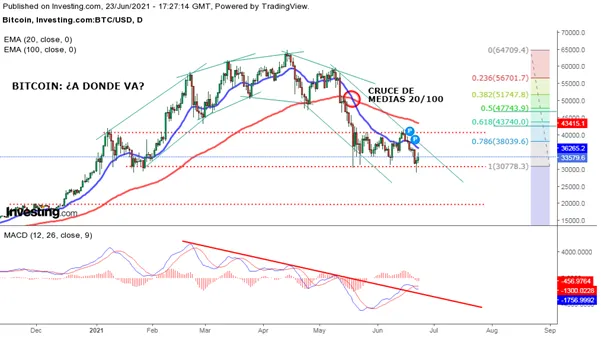
Comparto con ustedes mi análisis técnico sobre un gráfico diario de velas japonesas con medias móviles exponenciales de 20 y 100 períodos, así como el indicador MACD (12, 26, 9).
Conectando los máximos y mínimos relevantes, veníamos observando un canal alcista entre enero y mediados de abril de 2021.
Este quedó confirmado por las medias móviles. La media de 100 períodos se estableció como una suerte de soporte dinámico ascendente. De igual modo, el precio del bitcoin se mantuvo por encima de la media de 20 períodos casi todo ese tiempo.
El indicador MACD dio señales alcistas hasta finales de febrero. Pero, a partir de allí, a pesar de que el precio continuó marcando máximos y mínimos más altos hasta mediados de abril, el MACD comenzó a marcar una divergencia bajista.
Es decir, comenzó a anunciar anticipadamente de una probable pérdida de fuerza y caída del mercado.
En fin, quienes están activos en este mercado debieron comprar cuando se cumplieron dos condiciones simultáneas en el gráfico:
- El precio cortó al alza la media de 20 períodos, indicando momentum alcista.
- La línea MACD cortó de forma ascendente la línea señal de este indicador.
Si observas el gráfico, el mercado se agota a mediados abril y ya no puede ir más allá.
De hecho, el canal alcista que observas dibujado en el gráfico se vuelve cada más plano. Como mínimo debimos suponer que la tendencia alcista se detuvo.
El precio corta a la baja a la media de 20 períodos y lo mismo ocurre entre las líneas MACD y señal del indicador.
Ese fue un momento para permanecer fuera, esperando que el precio evolucionara un poco para tener claridad. De hecho, el precio va y testea la media de 100 períodos que venía funcionando como un nivel de soporte dinámico del precio.
El precio es rechazado al alza, sí. Pero, a continuación el próximo máximo que marca el mercado ni siquiera se acerca al máximo anterior. Terminó el festín alcista.
As for bitcoin, he arrived at high to $ 65,000 in April 2021 and certainly buy at those levels was not a good idea. Already the market had given a strong tour and at some point it was going to correct down.
I share with you my technical analysis on a daily chart of japanese candles with exponential moving averages of 20 and 100 periods, as well as the MACD indicator (12, 26, 9).
Connecting the relevant maximums and minimums, we were watching a bullish channel between January and mid-April 2021.
This was confirmed by the moving averages. The average of 100 periods was established as a kind of ascending dynamic support. Similarly, the price of Bitcoin remained above the average of 20 periods almost all that time.
The MACD indicator gave bullish signs until the end of February. But, from there, even though the price continued to mark maximum and minimum higher until mid-April, the MACD began to mark a bearish divergence.
That is, he began to announce in advance of a probable loss of strength and fall in the market.
In short, those who are active in this market had to buy when two simultaneous conditions were met in the graph:
- The price cut up the average of 20 periods, indicating upward momentum.
- The MACD line cut up the signal line of this indicator ascending.
If you observe the graph, the market is exhausted in mid April and can no longer go further.
In fact, the bullish channel that you observe drawn on the graph becomes flat. At least we should suppose that the upward trend stopped.
The price cut down the average of 20 periods and the same happens between MACD line and signal line of this indicator.
That was a moment to stay out, hoping that the price would evolve a bit to be clear. In fact, the price goes and testes the average of 100 periods that came functioning as a dynamic price support level.
The price is rejected upwards, yes. But, then the next maximum that marks the market does not even approach the previous maximum. The bullish feast finished.
Cruce de Medias a la Baja para el Bitcoin: Señal Bajista / Bearish Moving Average Crossing for Bitcoin: Bearish Signal

Para el 12 de mayo, el precio rompe en un solo día la media de 20 y de 100, indicando fuerte momentum a la baja.
Se produce así un cruce que es definitivamente señal bajista. Hacia el 19 de mayo el precio toca nuevos mínimos, descansando en niveles de precios no visitados desde enero de 2021.
Es claro que el precio entró en un rango lateral entre 30.000 $ y 40.000 $. ¿Estamos en una consolidación lateral para luego continuar la nueva tendencia bajista?
Si hacemos uso de los coeficientes de Fibonacci para el movimiento bajista entre abril y mayo, observaremos que ya el precio realizó una corrección alcista cercana al 30%.
Tenemos tres elementos a tener muy en cuenta las próximas semanas respecto al precio:
- Cómo se comporta al acercarse a la media de 20 períodos, que nos indica el momentum.
- Si la media de 100 períodos, convertida ahora en nivel de resistencia dinámico, mantiene ese límite. Ya su pendiente se volvió negativa.
- Cómo se comporta el precio cuando se acerqué al nivel de soporte del rango lateral actual. ¿Lo respetará o lo rompera?
For May 12, the price breaks in a single day the average of 20 and 100, indicating strong downward momentum.
Thus a cross is produced, which is definitely a bearish sign. By May 19 the price hits new lows, resting at price levels not visited since January 2021.
It is clear that the price entered a lateral range between $ 30,000 and $ 40,000. Are we in a lateral consolidation for continuing the new downtrend?
If we use the Fibonacci coefficients for the downward movement between April and May, we will see that the price has already made an upward correction close to 30%.
We have three elements to take into account in the coming weeks regarding the price:
- How it behaves when approaching the average of 20 periods, which indicates the momentum.
- If the 100-period average, now converted to a dynamic resistance level, maintains that limit. Already its slope turned negative.
- How the price behaves when it approaches the support level of the current lateral range. Will it respect it or break it?
¿Qué Escenarios le Esperan al Bitcoin? / What Scenarios Await Bitcoin?

Todo lo que hemos comentado no es realmente muy complicado de visualizar. Tan sólo basta con conocer y saber aplicar los fundamentos del análisis técnico sobre el gráfico.
Es un análisis post mortem, ya lo hechos ocurrieron, de manera que no hay nada que imaginar o adivinar, ya toda la información está allí. No hay nada especial en comentar lo que ya sucedió.
Lo que si resulta útil es qué podemos hacer con esta información para plantear escenarios alternativos con diferentes probabilidades de ocurrencia.
Recuerda, el mercado puede hacer lo que le plazca, nadie lo puede controlar y nadie sabe lo que va a pasar con 100% de certeza, es imposible…
Resulta más provechoso plantear posibles escenarios y tener claras todas las posibilidades. Las grandes pérdidas nacen de tener expectativas fijadas en nuestra mente, las cuales luego no son satisfechas por el mercado, por nuestra fijación con un único escenario.
Como “estábamos seguros” de que el mercado iba a ir en una única dirección, cuando esto no ocurre, mantenemos una posición abierta que resulta perdedora hasta que fundimos buena parte, o todo nuestro capital.
En ese caso, preferimos trabajar con estos posibles escenarios:
Everything we have discussed is not really very difficult to visualize. All you have to do is know and apply the fundamentals of technical analysis on the chart.
It is a post-mortem analysis, the events have already occurred, so there is nothing to imagine or guess, and all the information is there. There is nothing special about commenting on what has already happened.
What is useful is what we can do with this information to propose alternative scenarios with different probabilities of occurrence.
Remember, the market can do what it pleases, nobody can control it and nobody knows what will happen with 100% certainty, it is impossible ...
It is more profitable to raise possible scenarios and be clear about all the possibilities. Large losses arise from having expectations fixed in our mind, which are then not satisfied by the market, due to our fixation with a single scenario.
As we “were sure” that the market was going to go in only one direction, when this does not happen, we maintain an open position that is a loser until we melt a good part, or all, of our capital.
In that case, we prefer to work with these possible scenarios:
Escenario 1 / Scenario 1
Que el precio continúe en este rango lateral de consolidación por algún tiempo en niveles de precio entre los 30.000 $ y los 40.000 $.
En ese caso, dada la elevada volatilidad que puede presentar este activo, lo lógico es que permanezcas fuera del mercado mientras el precio no salga de este estrecho corredor con dirección clara.
La altura de este rango es de 10.000 $ y eso es mucho dinero. Pero, si realizas inversiones de posición al contado o swing trading, donde te posicionas y mantienes el activo por un tiempo prolongado, es mejor permanecer fuera.
Ahora bien, si realizas trading intraday, pues puede tener sentido operar en temporalidades pequeñas como 5 minutos, apoyándote en gráficos de 15 y 30 minutos.
Y aún así, debes tener en cuenta dónde estás operando, pues si el mercado te toma a contrapié y sale de este rango con fuerza, tendrás grandes pérdidas si no cierras rápido las posiciones perdedoras.
The price continues in this lateral consolidation range for some time at price levels between $ 30,000 and $ 40,000.
In that case, given the high volatility that this asset has, the logical thing is that you stay out of the market as long as the price does not leave this narrow corridor with a clear direction.
The height of this range is $ 10,000 and that's a lot of money. But, if you make spot position investments or swing trading, where you position yourself and hold the asset for a long time, it is better to stay out.
Now, if you do intraday trading, it may make sense to operate in small time frames such as 5 minutes, leaning on 15 and 30 minute charts.
And even so, you must take into account where you are trading, because if the market takes you on the wrong foot and comes out of this range with force, you will have big losses if you do not close the losing positions quickly.
Escenario 2 / Scenario 2
Que el precio corrija al alza hacia niveles Fibonacci entre el 61,8% y el 50%, hacia niveles de precio entre los 40.000 $ y los 50.000 $.
En este caso, pudiera tener sentido una operación en largo cuando el precio salga de este rango lateral, con confirmación en las medias de 20 y 100 períodos y el indicador MACD.
Además se esperaría que la resistencia rota se convierta en soporte.
Si este escenario ocurre, entras largo, y el mercado toma fuerza alcista y vas más allá de una corrección Fibonacci, podrías hacer buenas ganancias.
The price corrects upwards towards Fibonacci levels between 61.8% and 50%, on price levels between $ 40,000 and $ 50,000.
In this case, a long trade may make sense when the price breaks out of this lateral range, with confirmation in the 20-100-period averages and the MACD indicator.
Furthermore, the broken resistance would be expected to turn into support.
If this scenario occurs, you go long and the market takes bullish strength, and it goes beyond a Fibonacci correction, you could make good profits.
Escenario 3 / Scenario 3
Que el precio rompa la zona de soporte del rango lateral y continúe a la baja.
Consideramos que este podría ser un escenario más probable. En ese caso, vale la pena dejar que ocurra el rompimiento y el soporte se convierta en resistencia.
Si esto ocurre hay que dejar que el precio testee esa zona para confirmar.
Lo interesante en este escenario es especular qué tanto podría caer el precio.
Hubo un nivel de resistencia alrededor de los 20.000 $ que fue roto en diciembre de 2020, cuando se produjo el boom especulativo del bitcoin, y dada su volatilidad, pues no necesitaría de mucho para llegar a descansar sobre estos niveles de precio.
No digo necesariamente que vaya a caer a ese nivel, pero es el siguiente nivel relevante a la baja, así que debemos tenerlo presente. Podría caer a algún punto entre el precio actual y ese nivel.
Lo importante de visualizar los posibles escenarios es que todos requieren que ocurra algo para poder tomar una decisión. Por ello, se requiere paciencia para no cometer errores, viendo cosas que no existen, o cayendo en trampas alcistas o bajistas.
Debemos ser objetivos en nuestras valoraciones o perderemos nuestro dinero. No podemos ser pro-bitcoin o anti-bitcoin.
Esa no es la actitud de un inversionista profesional, que sólo intenta valorar las posibilidades y posicionarse para tomar ventaja de los escenarios más probables.
Hasta ahora, el bitcoin no puede considerarse como un activo refugio o de reserva de valor, su aumento tiene un fuerte contenido especulativo.
A esto ahora se le suma el tema medioambiental referente al proceso de minado y su huella energética. También está la hostilidad de las autoridades monetarias del mundo.
Sin embargo, pese a todo eso, no pasamos por alto su capitalización de mercado: nada menos que 626.530.000.000 $.
Hay mucho dinero colocado allí y no es precisamente de traders minoristas o pequeños inversionistas. Las apuestas, para los que apuestan y no te recomendamos hacerlo, son gigantescas.
Si bien, un estornudo del mercado puede evaporar cientos de miles de millones en pocas sesiones, pues, hay muchos intereses depositados en este activo especulativo que lucharán con todo para llevarlo más allá en su precio de mercado.
Y respecto a su carácter, sí es especulativo, no puede calificarse de otro modo…
En términos fundamentales, el valor de mercado del bitcoin debe estar muy muy muy por encima de su valor intrínseco. Eso significa que tarde o temprano el mercado deberá corregir hacia su valor fundamental, no lo olvides.
Espero te haya gustado este post y te resulte de provecho en tus estrategias de inversión o trading.
En mis próximos posts seguire comentando todos estos temas. Hasta la próxima estimado Hiver.
The price breaks the support zone of the lateral range and continues to go down.
We believe that this could be a more likely scenario. In that case, it is worth letting the breakout occur and the support turning into resistance.
If this happens, you have to let the price test that area to confirm.
The interesting thing in this scenario is to speculate how much the price could fall.
There was a resistance level around $ 20,000 that was broken in December 2020, when the speculative boom of bitcoin occurred, and given its volatility, it would not take much to come to rest on these price levels.
I'm not necessarily saying it's going to drop to that level, but it is the next relevant level down, so we need to keep that in mind. It could fall somewhere between the current price and that level.
The important thing about visualizing the possible scenarios is that they all require something to happen in order to make a decision. Therefore, patience is required to avoid making mistakes, seeing things that do not exist, or falling into bullish or bearish traps.
We must be objective in our valuations or we will lose our money. We cannot be pro-bitcoin or anti-bitcoin.
That is not the attitude of a professional investor, who only tries to assess the possibilities and position himself to take advantage of the most probable scenarios.
Until now, bitcoin cannot be considered as a safe haven or store of value asset, its increase has a strong speculative content.
To this now is added the environmental issue regarding the mining process and its energy footprint. There is also the hostility of the monetary authorities of the world.
However, despite all that, we do not overlook its market capitalization: no less than $ 626,530,000,000.
There is a lot of money in there and it is not exactly from retail traders or small investors. The bets, for those who bet and we do not recommend you doing so, are gigantic.
Although a market sneeze can evaporate hundreds of billions in a few sessions, then, there are many interests deposited in this speculative asset that will fight with everything to take it beyond its market current price.
And regarding its character, it is speculative, it cannot be described otherwise ...
In fundamental terms, the market value of bitcoin must be far, far above its intrinsic value. That means that sooner or later the market will have to correct towards its fundamental value, do not forget it.
I hope you liked this post and find it helpful in your investment or trading strategies.
In my next posts I will continue commenting on all these issues. Until next time dear Hiver.
Mis redes sociales:
Instagram: @jesuscastillo04041977
Twitter: @jactxx
My social networks:
Instagram: @jesuscastillo04041977
Twitter: @jactxx