
It’s time for my weekly look at the Bitcoin (BTC) price action for the week and try to make some sense of it all, and maybe make a prediction or two. It’s been an interesting week so far, so we’ll see how accurate I can be. I also do a weekly video on Saturday’s over on my YouTube channel, where you can get my end of week overview of a few of the larger cryptos.
For the usual disclosure, I am not a financial advisor, I don’t even work in finance at all. My day job is as a telecommunications software engineer. Treat everything you read here as some educational resources and not financial advice.
Weekly Chart Analysis
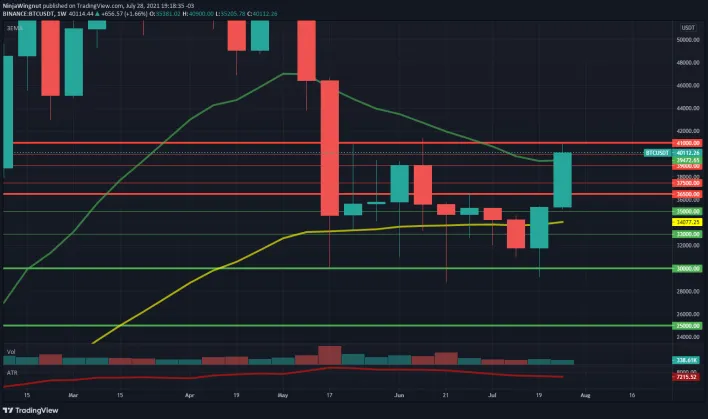
We are having a nice beefy week this week, blowing up past some resistance lines that I have had pegged for awhile, but not quite out of the top of my range yet. We are currently in a pretty critical area, and the way the market behaves in the next few hours and days will really spell out if we are really looking at a return to the bulls, or if this is just a bull trap.
I know things are looking very good, better than they have in awhile, and even I am starting to get the warm and fuzzy feelings, but this is where it is most critical to not let your emotions guide your trades, and let the technicals do it for you. I’m looking for a very specific sign from the market, and as of yet we haven’t hit it, but I must say, we are narrowing in pretty darn close to it. More on that later.
Daily Chart Analysis
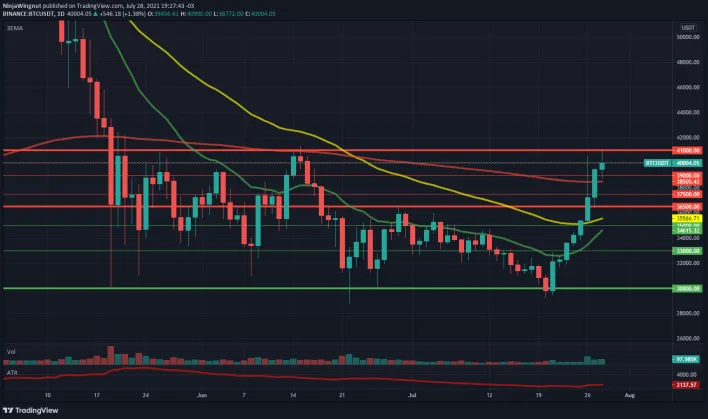
Looking at the daily chart is where things start painting a good picture for me. We can see a very clear uptrend forming, and we’ve taken quite a few key lines of resistance with little to no difficulty, but we are getting stuffed up at what is the most critical one, but it’s still early in this run, so I’m not concerned with finding a little resistance as we push up to the top.
In the last week we have seen a very solid bounce from below the bottom support line at $30,000 and a pretty meteoric rise past all 3 of the daily EMAs, plus my key lines all the up, most importantly we barely slowed down at the $36,500 line which I’ve had pegged as a line to beat for awhile now.
Currently we are hanging out between $40,000 and $41,000 with is my last key zone of resistance to beat, so we are narrowing in on what I am looking for to consider things back on the rise for real. Again, the next short bit is going to be very key, and I’ll outline exactly what I am looking for in my prediction section.
One good indicator on this chart is that on today’s candle, once we met the resistance at $41,000 and came down, we found support on the 200 day EMA. The fact this line gave us at least weakly tested support is a nice sign, especially when coupled with all the others. We had a nice uptick in volume the last week, especially over the last few days as the markets continue to push up, all of them good signs, but again, people get overly bullish near a top, so we have to watch for some key things to happen.
Hourly Chart Analysis
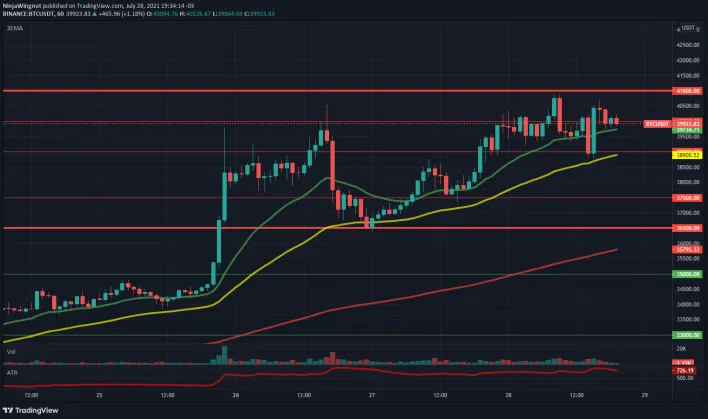
The hourly chart is showing a nice clear uptrend with all three of the EMAs stacked up in the nice green through red pattern that I always love to see, and following the stairs upward getting support by both of the shorter term EMAs as well.
We can see that we have some price pressure both at $40,000 and $41,000, which is what we would expect given the daily chart outlines, but we are not having any major dump offs where we are breaking any of the trend lines, and things seem to be putting pressure on the upper resistance lines, and one of these has to break, the question is going to be if it breaks to the upside or the downside.
Bitcoin Dominance
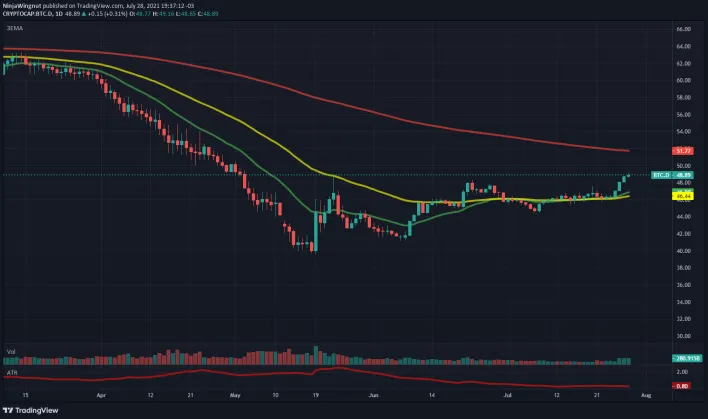
The dominance chart is definitely showing us that Bitcoin is the big winner currently, taking a lot more of the incoming money than the alts are, but with the current market pump, there is a lot to go around, so we don’t see a lot of alts getting squeezed out, but they are also not running as hard as the big guy.
For the short term, this is not necessarily a bad sign, we are not currently in an alt season, but that does not mean once the market recovers that we don’t start seeing the dominance factor start squeezing down. If the bulls start running, the tend to focus on Bitcoin a lot until it starts getting near what they believe to be the top, and start looking at alt coins to squeeze a little more before the bull blow off top and entry into the bear market.
My Prediction
This is going to involve something very specific I am looking for in order to confirm an entry into the market at a point I believe confirms the market returns to a bull state. I need to reiterate, I’m some guy on the internet, I am not a qualified financial advisor, and I’m definitely not your financial advisor. I would highly recommend not following me into the market at the point I am going to say, unless a) You’ve done your own research and understand the risks involved in crypto, b) Your research has lead you to the same conclusions that I have arrived at, c) you understand this is not financial advice, and d) You are using this more as a corroboration that what you think is going to happen, at least one other random person agrees.
With that out of the way, here is what I’m looking for in order to confirm that I think this market is ready to heat up and start running again. I want to see a breakout that goes a non-insignificant amount above $41,000. I don’t have an exact number I want to see it hit, but I want it to be a nice clear breakout above that upper resistance point I have had pegged.
After that nice clear breakout, I want to see the market hit a top and have a retracement back, because the market will always have a correction at some point. And then I want to see that retracement stop and find support at least at the $41,000 point, if not higher, and make a nice clear bounce off that point. I basically want confirmation that $41,000 or higher has become a nice clear area of support. At that point, I will pop the champagne, call the market healthy and make my “day trading” entry on a long position.
If the market can’t make the push above and maintain that line, I am going to expect to see if fall back down in the low $30,000 range, and make one final test of the support down there before making the recovery. If we do see it fall again from where it is, I am only going to expect it to fall one more time, and hopefully make recovery from there, but I am still hopeful that we see the breakout now, and the recovery is happening as I type this out.
Again, one guys opinion and it’s highly recommended you do your own research, I can’t stress this enough, people get rekt in crypto everyday by blindly following someone’s advice. Don’t be that person.
Socials And Other Links
Find me on social media on Twitter, Facebook, Instagram, Telegram and noise.cash.
If you enjoyed this content, you can check me out every weekday. My posts start at my website, but you can also find them cross posted at Publish0x, LeoFinancial, Hive, and read.cash.
I also post a weekly price update video every Saturday over on my YouTube channel, where I will be discussing the weekly price action for some of the major cryptos. You can also sign up for my newsletter which I send out every Friday with news and whatnot from the crypto space, delivered right to your inbox!
You can also find links to resources such as research and news sites over at this link.
Want some more content right now? Check out some of my previous posts:
Next Level Swaps: SwapSpaceExplained
Why Is DeFi Expensive
DeFi Money Markets
Sushi
A few referral links, in case you are interested in the service, and it also helps me out.
Binance – large centralized exchange – referral link saves you 10% on trading fees
Coinbase – basic crypto exchange – referral link gets you bonus crypto on first deposit
Cointiply – very good crypto faucet and earning site – no bonus for you on this referral unfortunately
Originally Posted On My Website: https://ninjawingnut.xyz/2021/07/28/weekly-btc-6/