Today as usual let's take a look at some Glassnode metrics. The recent spikes in bitcoin prices have been produced by a considerable increase in transactions made in derivatives.
Since these transactions also move prices a lot in the short term, but tell us nothing about the real trend in the medium to long term, let's see how the spot market (i.e. traders who invest in cryptos and not in the corresponding derivatives) reacted to this rise in quotes.
The rise of the btc quotation has made it so that the percentage of coins kept on deposit by the holders and that would be in profit if they were sold has risen to 98.34%.
In practice, now at these prices almost all the coins held on deposit is theoretically in profit.
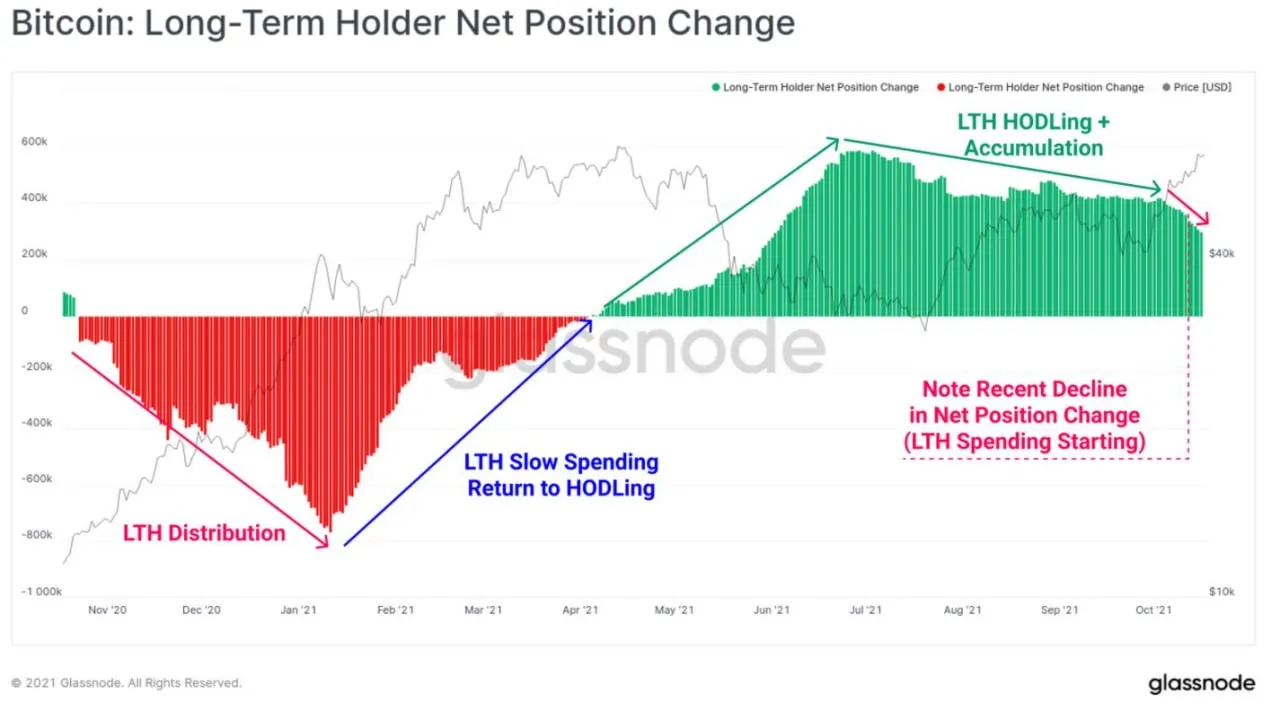
So, the long-term holders, i.e. those who have been holding btc for more than 155 days, have started to sell some coins, in a very moderate way, reducing a bit the long accumulation phase that we have seen in these months (the green wall starts to reduce on the right of the chart).
The gradual reduction of the accumulation phase is the first sign of a possible resumption of a real bull trend.
Last week I had already posted clues to this veering from an accumulation phase to a distribution phase.
This week's metrics confirm this trend.
To give an idea of how long it takes a distribution phase to fully unfold into a bull trend, we can compare a couple of metrics and see the current values compared to those that were reached at the height of the bull trend that ended last April.
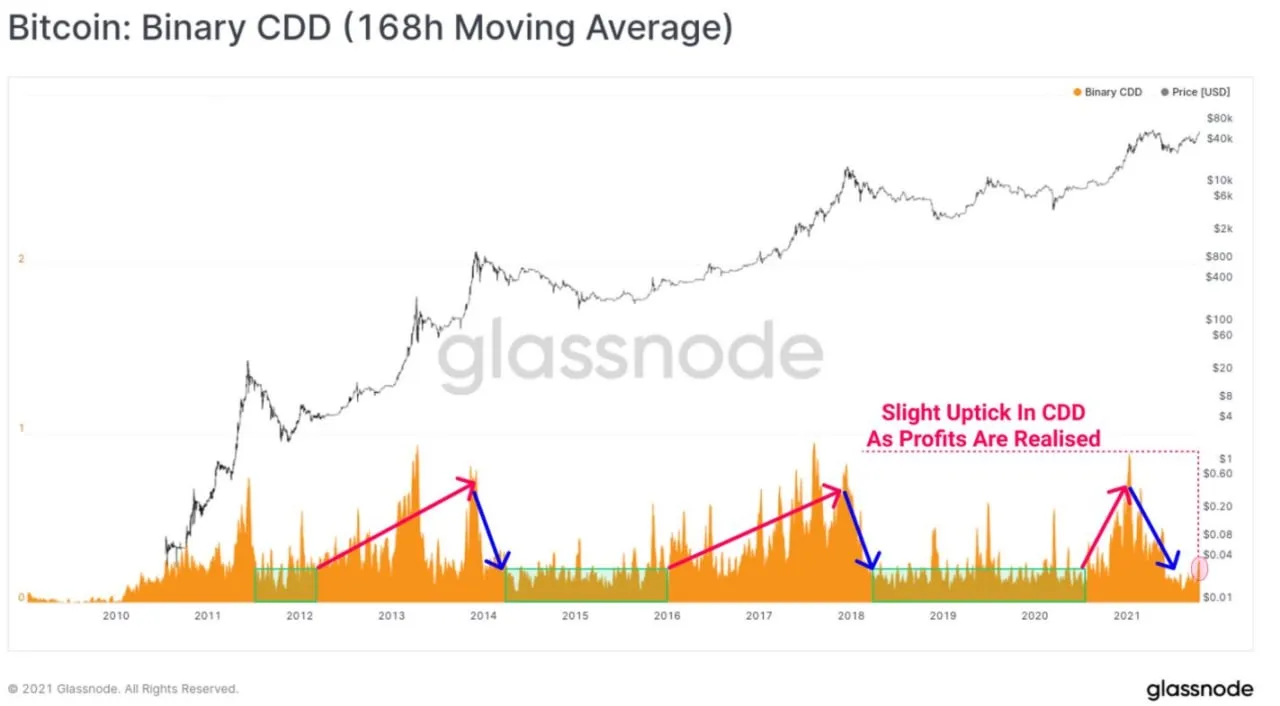
The first metric is CDD (coin-days destroyed), which is the coins mobilized from deposits that are spent each day (basically, it measures an increase or decrease in transaction volumes).
As you can see, the orange wave has started to rise on the far right of the chart (small pink circle), but it is still far from the peaks reached in the previous bull trend.
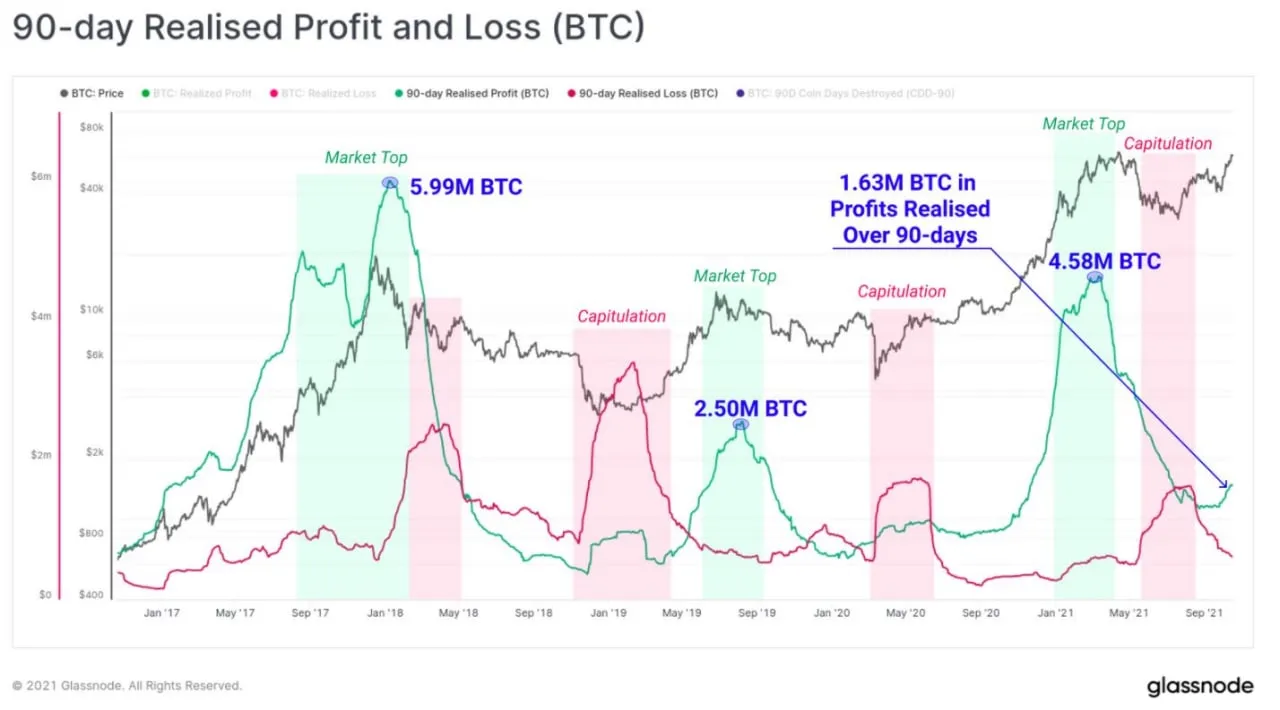
Another metric is the profit/loss ratio in trades over the last 90 days.
Again, the green curve is rising, but it is far from the peaks reached in the previous bull market.
There are other metrics that show exactly the same thing: a beginning of a still moderate distribution phase and very far from the excesses of the extreme bull market phases.
For the sake of brevity I will omit them, but all of them tell us that this distribution phase, assuming it will continue, will need a few months (2 to 5 months) to produce new highs in bitcoin quotes.
If you are interested in learning more I suggest you take a trip to Glassnode's site from which I took the metrics.
Thanks for reading