Hello there. I haven't shared a Bnb chart for a long time. I was away from Bnb for a while. As you know, Defi transactions have started on the Hive blockchain :) The graphic diary I will share. It contains BNB/USDT data of the Binance exchange. Screenshot taken from Tradingview.com.
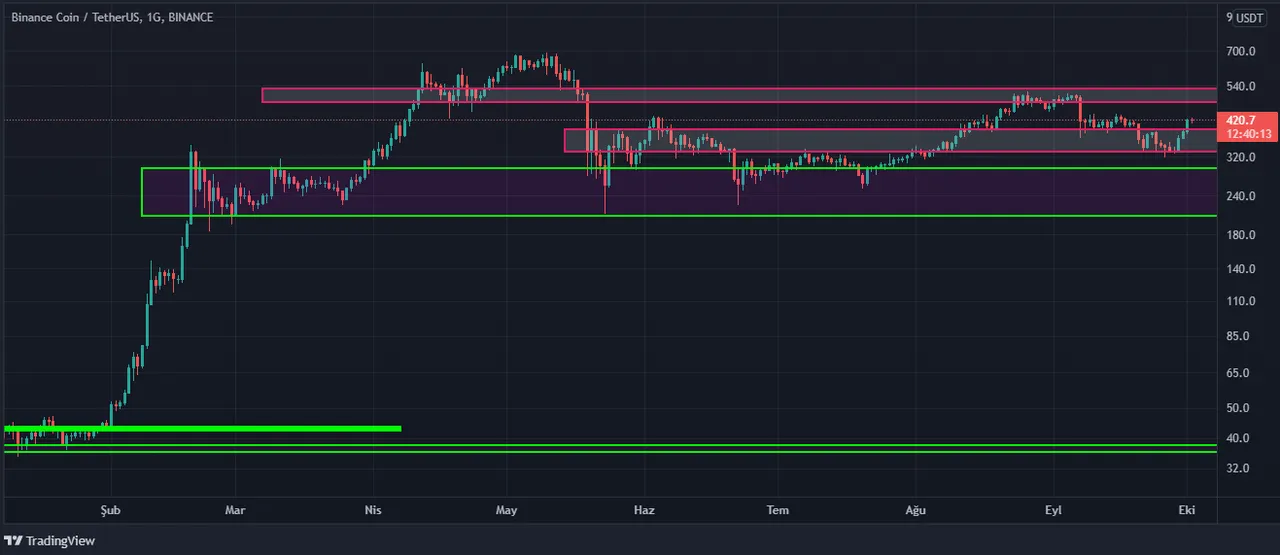
As can be seen in the chart, it has been zigzagging between two supply-demand zones for a long time. Above is the 481-527 resistance. Below is support for 206-294. In the middle, there is a supply-demand region in the $332-391 price range. Bnb is needed for general defi transactions. For this reason, there is an upward buying pressure. There is some selling pressure due to the turmoil in the general cryptocurrency market. Let's see which direction will prevail.
I am not an investment advisor. You should make your investment decisions according to your financial and psychological state. It would be more useful to see this sharing as an educational work. See you in new posts.