Hi, there readers i will be exploring psychology behind using some important candlestick patterns which can help boost your trading skill.
In your own words, explain the psychology behind the formation of the following candlestick patterns.
Bullish engulfing Candlestick pattern
Doji Candlestick pattern
The Hammer candlestick pattern
The morning and evening star candlestick pattern.
Bullish engulfing Candlestick pattern
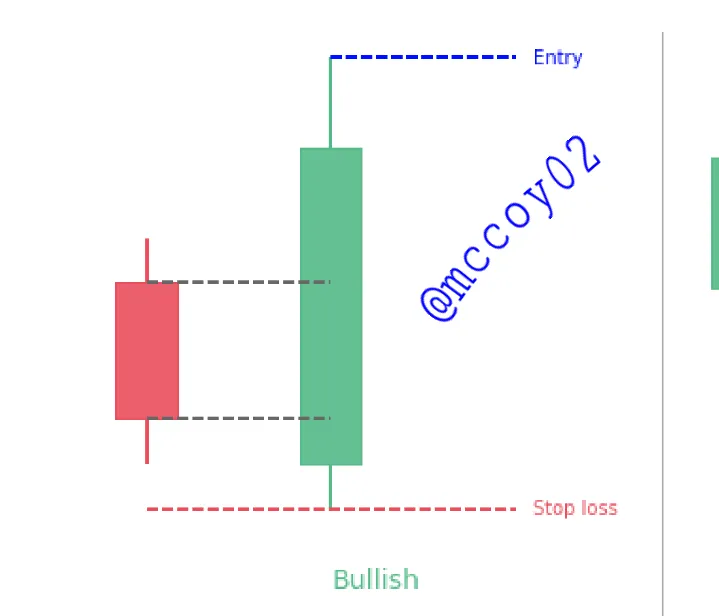
The bullish engulfing pattern in trading is a signal that normally indicates there could be a bull market which means in this pattern traders are getting ready for a big market move up/uptrend when this pattern starts forming it also means the sellers in the market ( bear ) are becoming exhausted and exiting their traders taking profit, giving room for buyers ( bull ) to dominate the market.
This kind of pattern can be observed or located when a bearish candle is immediately followed by a large bullish candle.
From the image above it can be seen a small bearish candle in red was immediately followed by a large bullish candle.
The large bullish candle can also be seen to have completely overlapped the bearish candle in red, which means the bullish candle closes higher than the bear candle.
It can also be noted that for this kind of pattern to happen a trader need to wait for clear confirmation of a large bullish candle to avoid a false breakout.
When these patterns are identified in the market it makes traders get ready for a bull rally which means there will be upward price movement.
Doji Candlestick pattern
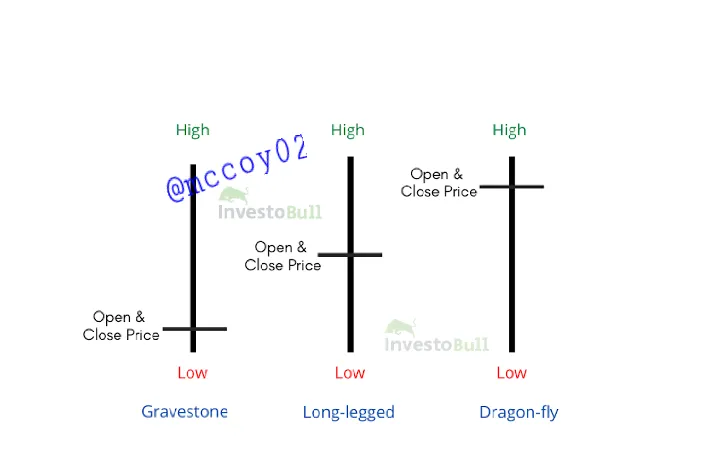
Doji pattern in trading can be identified easily by traders this type of trading candle pattern comes without a full-body which means the Doji candle doesn't have full candle anatomy like the body (Doji candle pattern body are extremely short) it can only be identified by its close and open in the market.
Doji pattern candlestick** in most cases have the same closing and open price which makes their bodies very short to be easily identified, their body in trading charts is mostly represented/appears as a thin line.
Doji pattern in trading charts shows the market is in a neutral zone which means both the buyers and sellers are indecisive about where the market will be heading either up or downtrend, if such pattern keeps recording it, means traders are to wait patiently for the market to make a clear movement.
The Hammer candlestick pattern
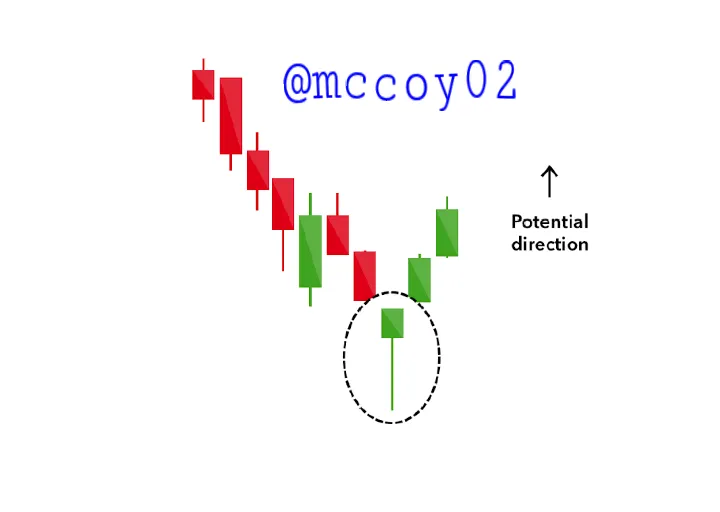
A Hammer in trading represents a bullish reversal pattern that is formed during a downtrend.
Here traders are exhausted from a long bear market with has made the bull exit all trades waiting for a valid confirmation when a hammer is identified it shows the sellers are beginning to take profit and where the bull will take charge of the market.
The morning and evening star candlestick pattern.
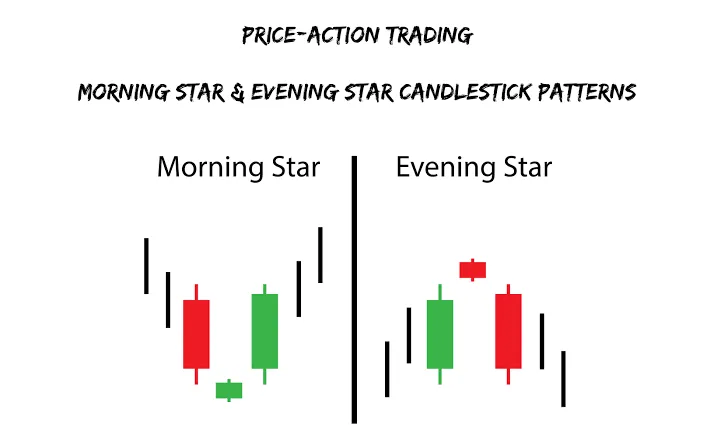
As seen from the screenshot above The morning and evening star candlestick pattern has an identical pattern of triple candlestick patterns they usually are found at the end of a trend in most cases they are used to represent reversal pattern in a trend.
The morning star represents a bullish pattern that normally occurs at the bottom of the downtrend.
The first candle is preferably bearish which is followed by an indecisive second candle which can be a bear or bull and the third candle is a bull which represents/confirm a reversal
In this type of trading, pattern traders get ready for a bull run.
While the evening star pattern occurs at the top of an uptrend.
The first can is preferably a bullish pattern and followed by an indecisive second candle and lastly, a bear can confirming the reversal.
In this type of trading pattern traders get ready fora bear market.
Identify these candlestick patterns listed in question one on any cryptocurrency pair chart and explain how price reacted after the formation. (Screenshot your chart for this exercise)
Bullish engulfing Candlestick pattern
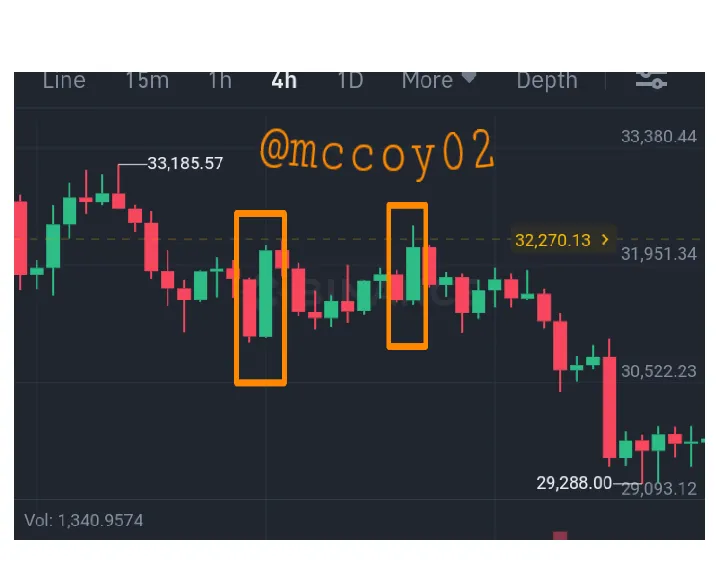
The screenshot above is taken from my binance trading app from the chart it can be seen how the market/traders reacted to the trading pattern the bearish candlestick was immediately followed by a bullish pattern of candlestick which showed there was price change as the bullish candle closes higher than the bear candle representing a bull market.
It can be seen from the chart there was a quick change in the market trend as the trend pattern continues to move in a bullish trend which shows buyers were taking charge of the market.
Note the above chart is a BTC/busd pair chart of a 4-hour timeframe.
Doji Candlestick pattern
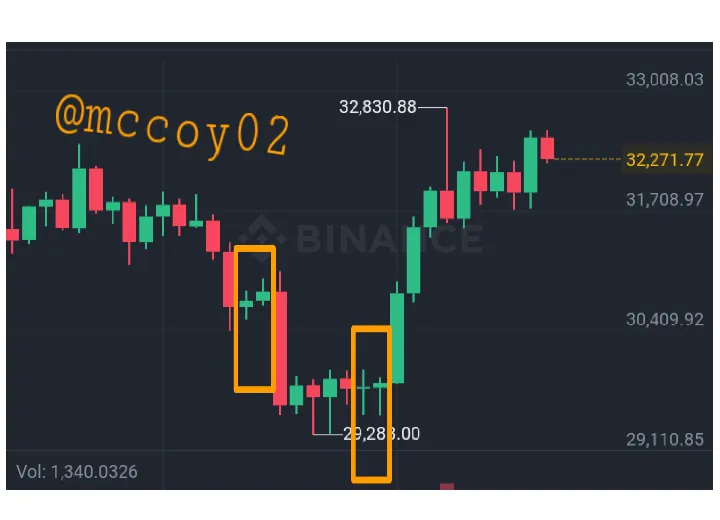
This is also a 4 hour time frame BTC/busd pair taken from my binance trading app.
Looking at the previous candlestick it can be seen that the market was in a bearish pattern indicating sellers in charge of the market but with the preceding Doji there seems to be a halt in the market trend which keeps the market at a neutral zone it can also be seen after each Doji a market trend being to form which indicates decision has been made and the market began to move.
The Hammer candlestick pattern
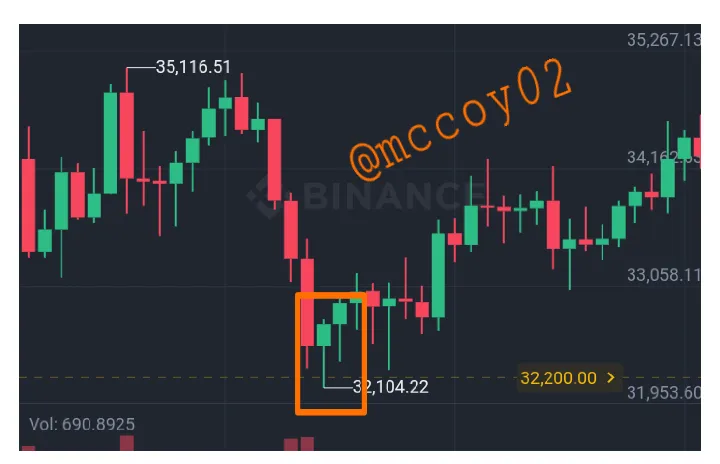
The above screenshot is also taken from my binance trading app.
It can be seen how the price moved in a downtrend with the appearance of a hammer It also be observed how there was a reversal in the bearish market to a bull market.
This shows how significant the candlestick hammer pattern is in trading as it can reverse a bear market to bull.
The morning and evening star candlestick pattern.
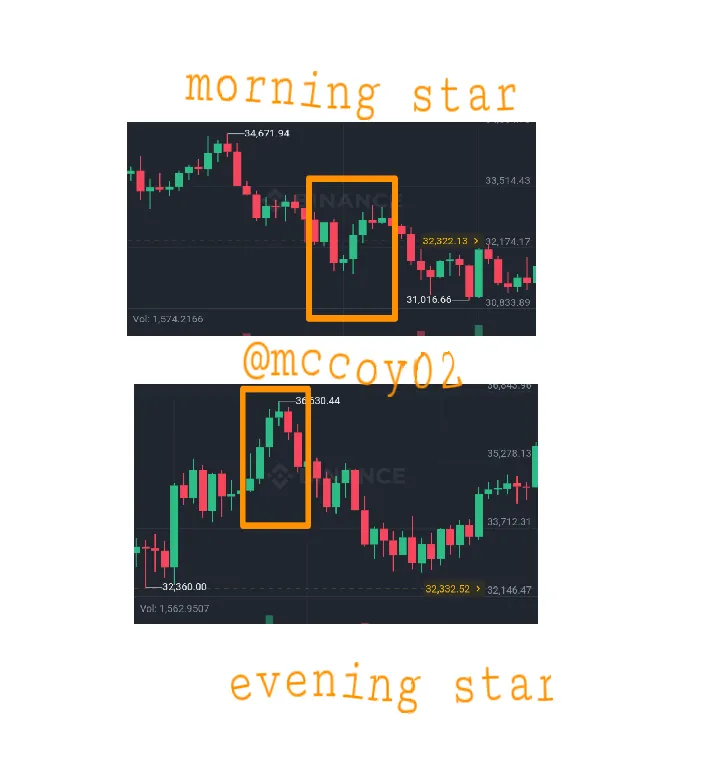
The morning star is followed by a bear candlestick and preceded by a bull pattern here traders wait for clear confirmation before entering the market, in this kind after the second candlestick is formed a clear market movement will be seen and here a downtrend was confirmed making buyers exit the market as seller dominate.
The evening star is the opposite of a morning star as it is followed by a bull candlestick after waiting for a clear confirmation the market, will move from bull to bear base on the above screenshot pattern.
Conclusion
Although trading with patterns can be very fun it's is advisable as any trader dives more into the trading space he/she must acquaint themselves with various technical and functional analysis tools relying on trading patterns alone can be dangerous to any trader.
Also, candlestick patterns can help traders make decisions when trading with the help of technical tools like RSI, MA, and more.