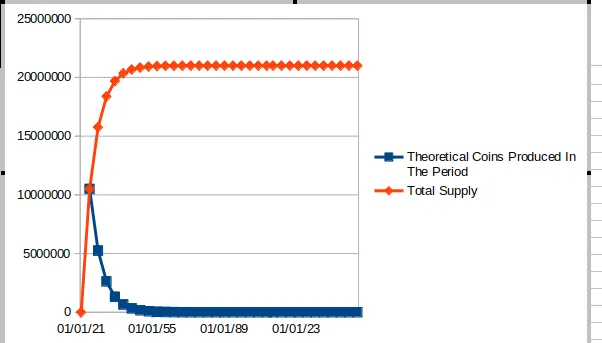
| Start Date | End Date | Block reward | Theoretical Coins Produced In The Period | Total Supply |
|---|---|---|---|---|
| Feb 2021 | Feb 2025 | 50.000 000 00 | 10 500 000 | 10 500 001 |
| Feb 2025 | Feb 2029 | 25.000 000 00 | 5 250 000 | 15 750 001 |
| Feb 2029 | Feb 2033 | 12.500 000 00 | 2 625 000 | 18 375 001 |
| Feb 2033 | Feb 2037 | 6.250 000 00 | 1 312 500 | 19 687 501 |
| Feb 2037 | Feb 2041 | 3.125 000 00 | 656 250 | 20 343 751 |
| Feb 2041 | Feb 2045 | 1.562 500 00 | 328 125 | 20 671 876 |
| Feb 2045 | Feb 2049 | 0.781 250 00 | 164 063 | 20 835 939 |
| Feb 2049 | Feb 2053 | 0.390 625 00 | 82 031 | 20 917 970 |
| Feb 2053 | Feb 2057 | 0.195 312 50 | 41 016 | 20 958 985 |
| Feb 2057 | Feb 2061 | 0.097 656 25 | 20 508 | 20 979 493 |
| Feb 2061 | Jan 2065 | 0.048 828 12 | 10 254 | 20 989 747 |
| Jan 2065 | Jan 2069 | 0.024 414 06 | 5 127 | 20 994 874 |
| Jan 2069 | Jan 2073 | 0.012 207 03 | 2 563 | 20 997 438 |
| Jan 2073 | Jan 2077 | 0.006 103 51 | 1 282 | 20 998 719 |
| Jan 2077 | Jan 2081 | 0.003 051 75 | 641 | 20 999 360 |
| Jan 2081 | Jan 2085 | 0.001 525 87 | 320 | 20 999 681 |
| Jan 2085 | Jan 2089 | 0.000 762 93 | 160 | 20 999 841 |
| Jan 2089 | Jan 2093 | 0.000 381 46 | 80 | 20 999 921 |
| Jan 2093 | Jan 2097 | 0.000 190 73 | 40 | 20 999 961 |
| Jan 2097 | Jan 2101 | 0.000 095 36 | 20 | 20 999 981 |
| Jan 2101 | Jan 2105 | 0.000 047 68 | 10 | 20 999 991 |
| Jan 2105 | Jan 2109 | 0.000 023 84 | 5 | 20 999 996 |
| Jan 2109 | Dec 2112 | 0.000 011 92 | 3 | 20 999 998 |
| Dec 2112 | Dec 2116 | 0.000 005 96 | 1 | 21 000 000 |
| Dec 2116 | Dec 2120 | 0.000 002 98 | 1 | 21 000 000 |
| Dec 2120 | Dec 2124 | 0.000 001 49 | 0 | 21 000 001 |
| Dec 2124 | Dec 2128 | 0.000 000 74 | 0 | 21 000 001 |
| Dec 2128 | Dec 2132 | 0.000 000 37 | 0 | 21 000 001 |
| Dec 2132 | Dec 2136 | 0.000 000 18 | 0 | 21 000 001 |
| Dec 2136 | Dec 2140 | 0.000 000 09 | 0 | 21 000 001 |
| Dec 2140 | Dec 2144 | 0.000 000 04 | 0 | 21 000 001 |
| Dec 2144 | Dec 2148 | 0.000 000 02 | 0 | 21 000 001 |
| Dec 2148 | Dec 2152 | 0.000 000 01 | 0 | 21 000 001 |
As you can see from the table, made with Libre Office, we should get a halvening every four years. This is the expected distribution. Theoretical Coins is rouneded off the to the nearest integer for easier display.
I've taken into account the changes made by @proofofbrainio as I understand them. I am seeing things diverge from this though.
According to Scot Bot these are the statuses of these three currencies: VIBS, POB, and LEO.
| VIBES | POB | LEO | ||
|---|---|---|---|---|
| start_date | 24 Feb | 28 Feb | 17 June | 2019 |
| reduction_every_n_block: | 2,100,000 | 42,000,000 | 10,512,000 | |
| days per reward period | 73 | 1,458 | 365 | |
| reduction_percentage | 21.00% | 50.00% | 7.00% | |
| rewards_every_n_block | 1 | 10 | 1 | |
| rewards_token_every_n_block | 19 | 40 | 19 | |
| Calculated Total Supply | 526,316 | 21,000,000 | 7,903,759 | |
| Current Supply | 137,923 | 626,277 | 3,418,409 | |
| total_generated_token | 13,792,346,000 | 62,627,700,000,000 | 3,418,409,220 | |
| precision | 5 | 8 | 3 | |
| Calculated Issued Percentage | 26.21% | 2.98% | 43.25% |
About 3% of total Proof of Brain rewards have been distributed. Now according to Hive-Engine.com website, LEO has a circulating supply of 7.992 million but Scot Bot reports 3.418 million. The Hive-Engine website reports 248,606 VIBES circulating. The Scot Bot reports 137,923 VIBES. The Proof of Brain is the only one that has agreement between Hive-Engine, and Scot-Bot and my calculations. I guess the difference is something like ICOs account for the differences.