Good evening to everyone . Here is the past weeks staking details.
This is a win -win for both stakers as well as community since it reduces liquid supply .
So I just retrieved the data for the past week -
Note
This contains staking POB data from 20th September to 26th September ( Monday to Sunday)
Data related to POB staking
How many times did users stake in the past week ?
- Last week - 1655
- This week - 1779
How many unique users staked POB?
- Last week - 472
- This week - 504
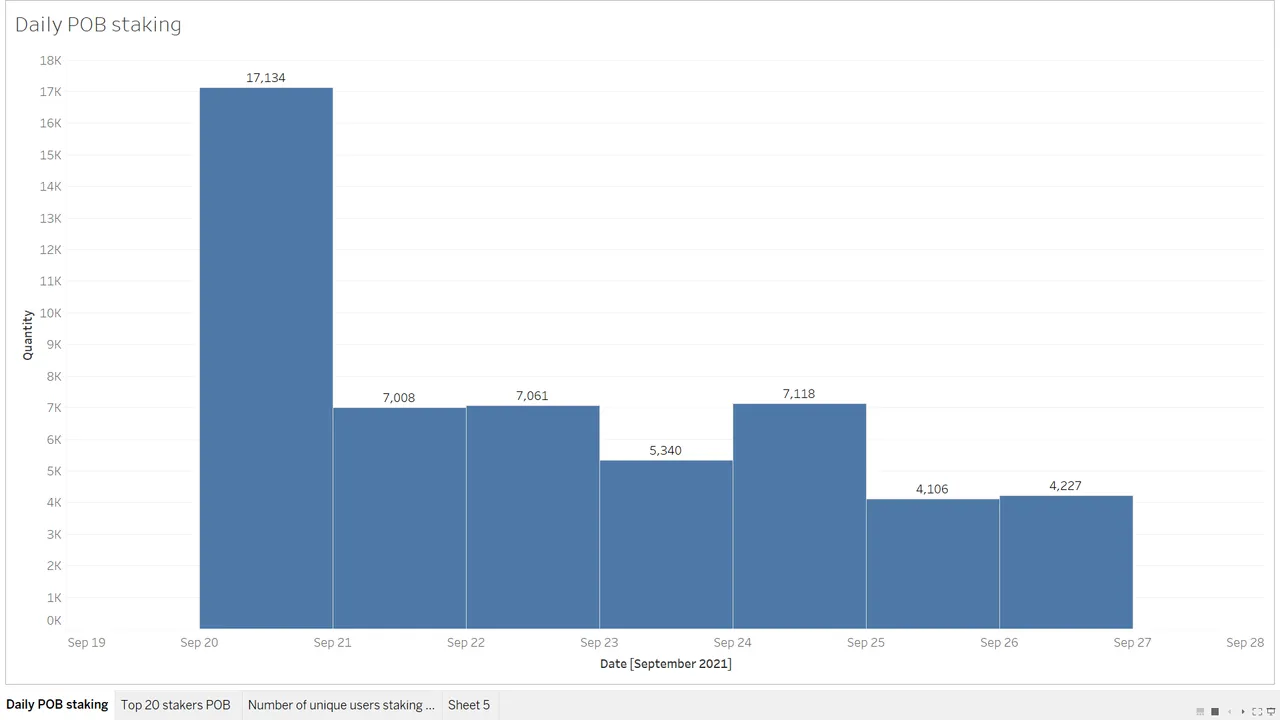
Total POB staked during this period
- Last week - 38653.358 POB
- This week - 51994.343 POB
Average POB staked at once
- Last week - 23.35 POB
- This week - 29.22 POB
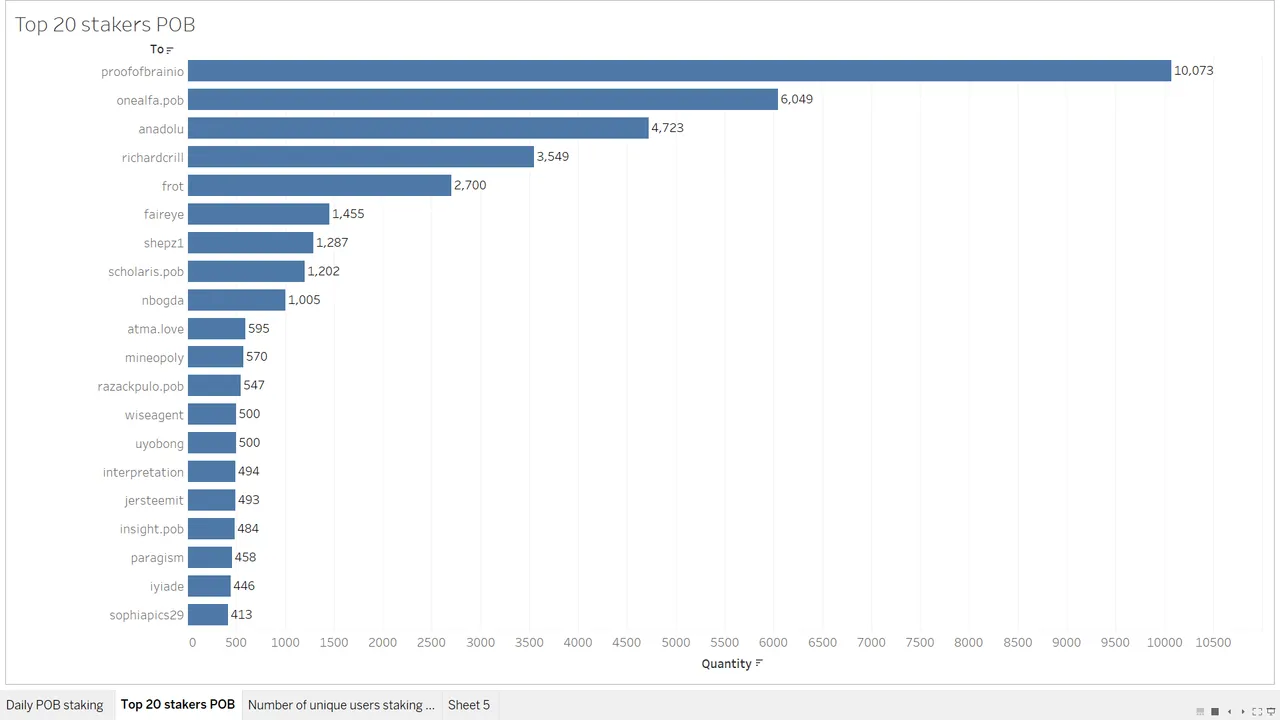
Top 25 stakers
| Account | Amount |
|---|---|
| @proofofbrainio | 10072.629 |
| @onealfa.pob | 6048.62 |
| @anadolu | 4722.986 |
| @richardcrill | 3549.054 |
| @frot | 2700.0 |
| @faireye | 1455.0 |
| @shepz1 | 1286.972 |
| @scholaris.pob | 1202.317 |
| @nbogda | 1004.893 |
| @atma.love | 594.691 |
| @mineopoly | 570.272 |
| @razackpulo.pob | 547.0 |
| @wiseagent | 500.0 |
| @uyobong | 500.0 |
| @interpretation | 493.79 |
| @jersteemit | 493.103 |
| @insight.pob | 484.046 |
| @paragism | 457.529 |
| @iyiade | 446.131 |
| @sophiapics29 | 413.134 |
| @harpreetjanda | 376.452 |
| @friendlymoose | 376.336 |
| @ura-soul | 356.158 |
| @botvotes | 341.804 |
| @vempromundo.pob | 314.297 |
Data through Charts
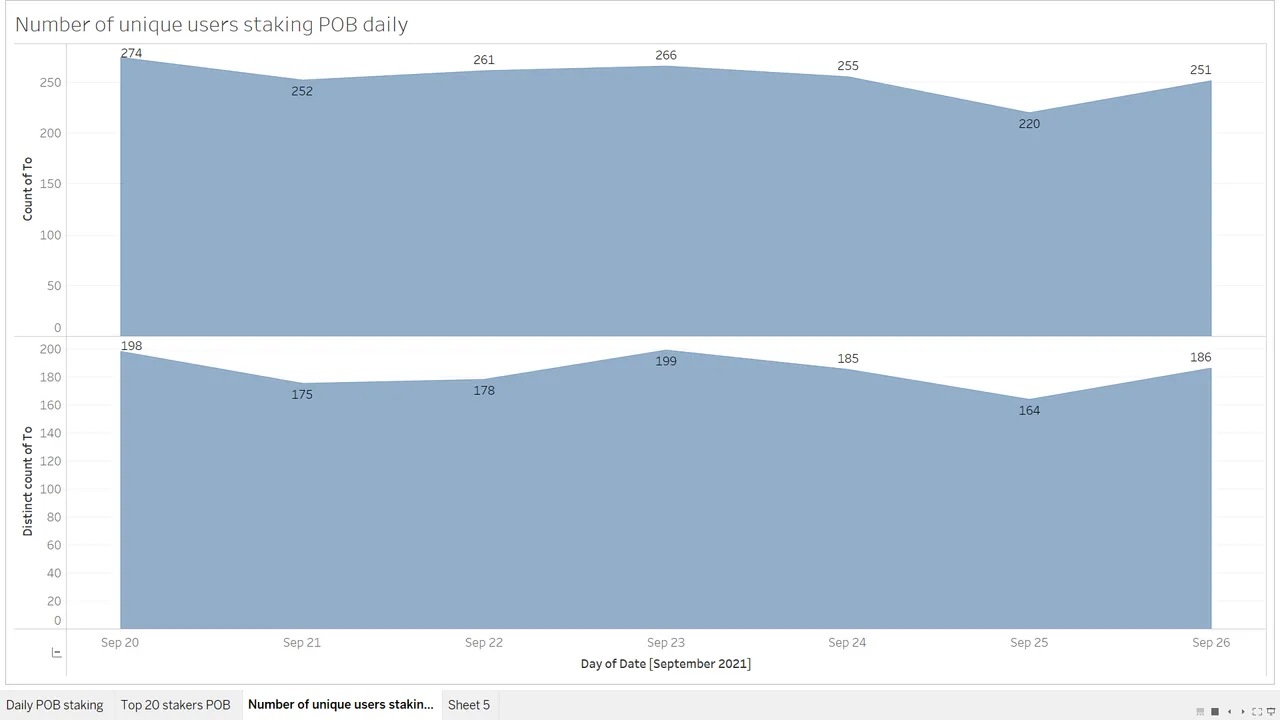
Difference between top chart and bottom chart is that , top chart shows number of times POB was staked but the bottom chart takes number of unique users who staked POB .
So if say @amr008 stakes POB thrice on Monday , in the top chart it counts as 3 but bottom chart it is just 1.
Regards,
MR