Spending HBD: Hype or Real Trend?
If you regularly browse the Hive trending pages, you will likely have noticed the resurgence of posts about spending HBD. @hivesucre have been running a merchant on-boarding campaign getting people to spend HBD in local shops since early 2023, but more recently there's also #spendhbd, a broader campaign to get people using HBD for buying stuff in general.
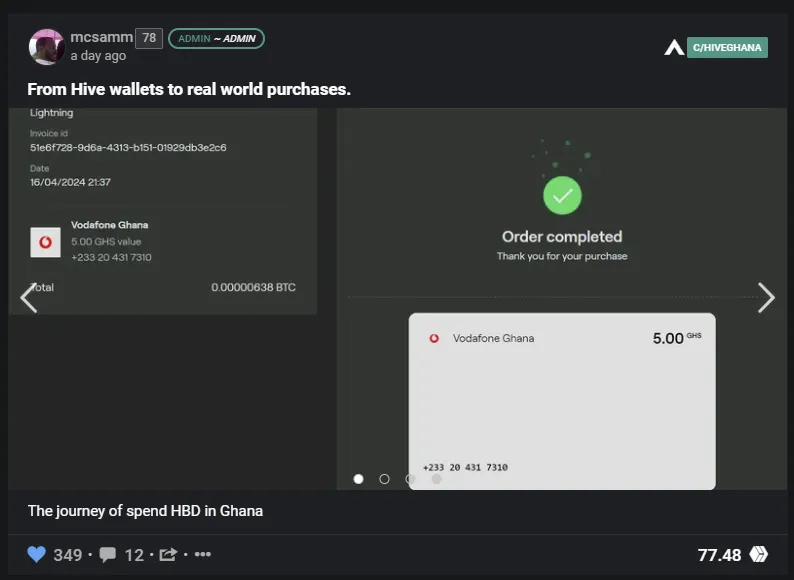
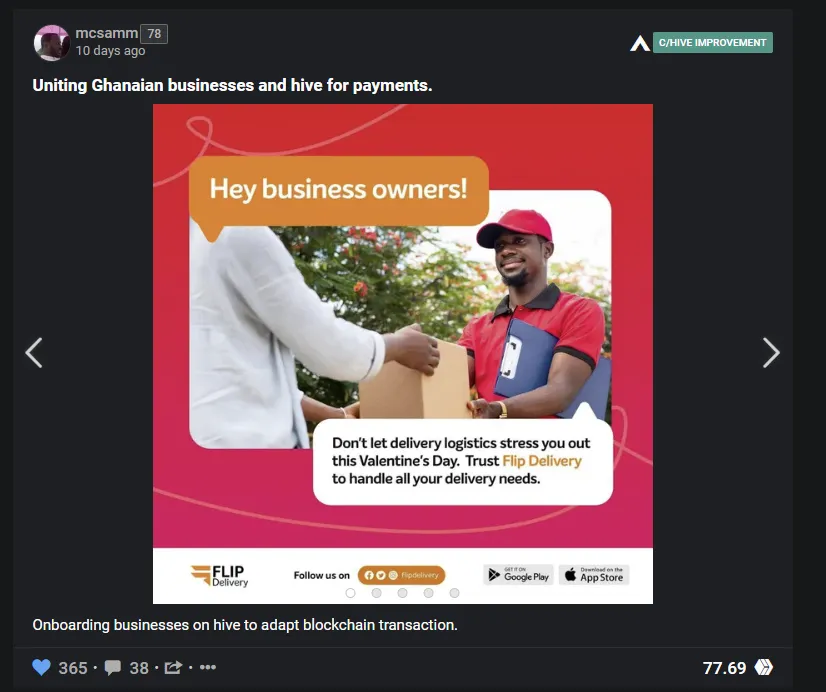
While @hivesucre are still very much the leader in this, we can also see it in other parts of Latin America and beyond. The growing Ghanaian community on Hive has started to pick up on this trend, where Hivers are using established systems like V4V with BitRefill as well as some businesses starting to join led by @mcsamm.
HBD Statistics
So, is this just a story being made up for blog posts, or is the use of HBD actually on the rise? One of the best things about Hive is that every transaction is public and recorded permanently, so we always have the opportunity to dig into the data and examine it for ourselves.
HBD Transfers Per Day
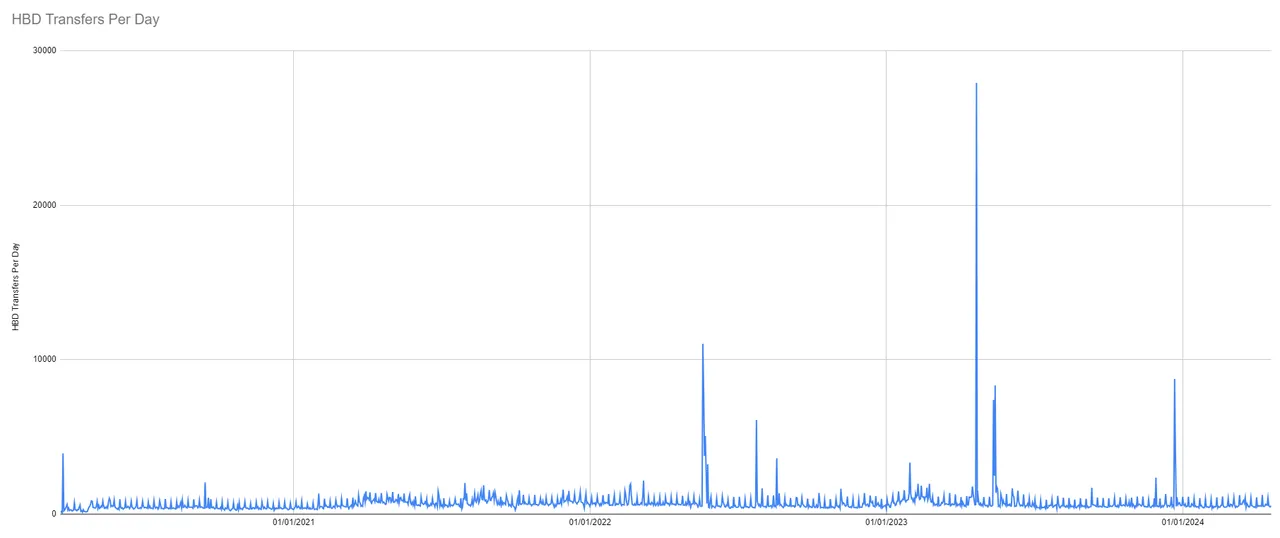
Overall use of HBD for transfers is quite small, and we can't see any particular trend looking at all HBD transfers. However, if you actually explore these transactions on chain, some things are noticeable. Because transfers are basically free and they can include a human readable text string, they are often used as a form of messaging, advertising and spam. Any long time Hive user will be familiar with these messages that show up in your wallet.

Aside from messages/spam, still most HBD transfers relate to crypto trades (transfers between exchanges or internal market trading accounts) and delegation rewards. In order to examine HBD payments, we have to first filter out these transactions, so that's what I've done below. This leaves us with a much smaller number of transactions, showing us the small scale of HBD for payments, but it is more meaningful data.
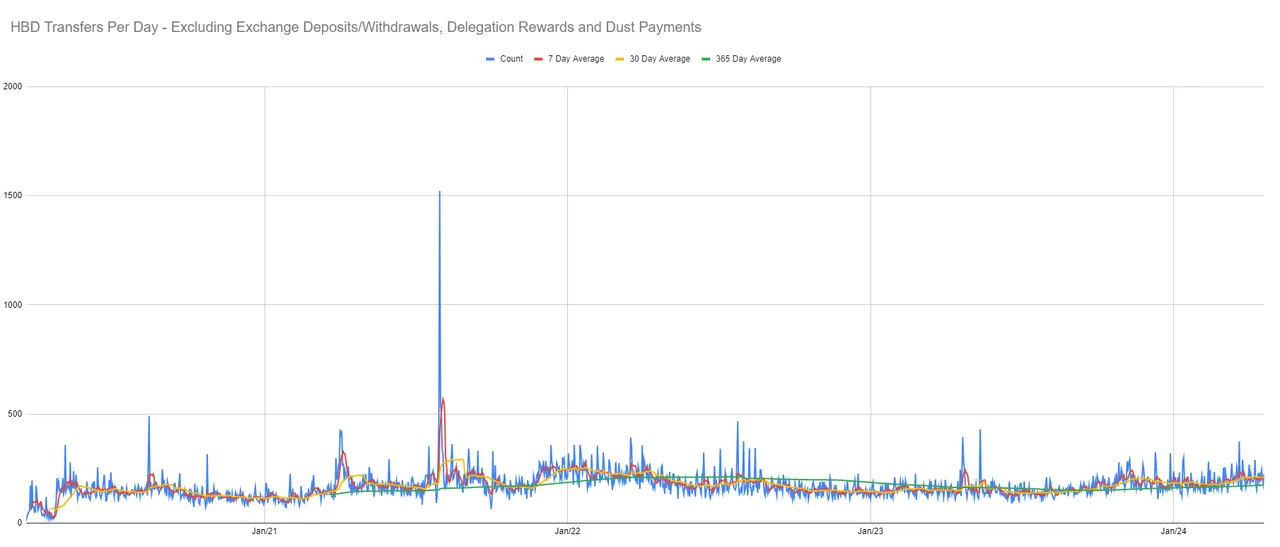
We can see here that the number of HBD transfers is growing compared to 2023, but it has not surpassed what we saw in 2021/22, when Hive was in a strong bull market. Below is another way of looking at this, with the cumulative number of transactions year to date, with each year (2021-2024) aligned.
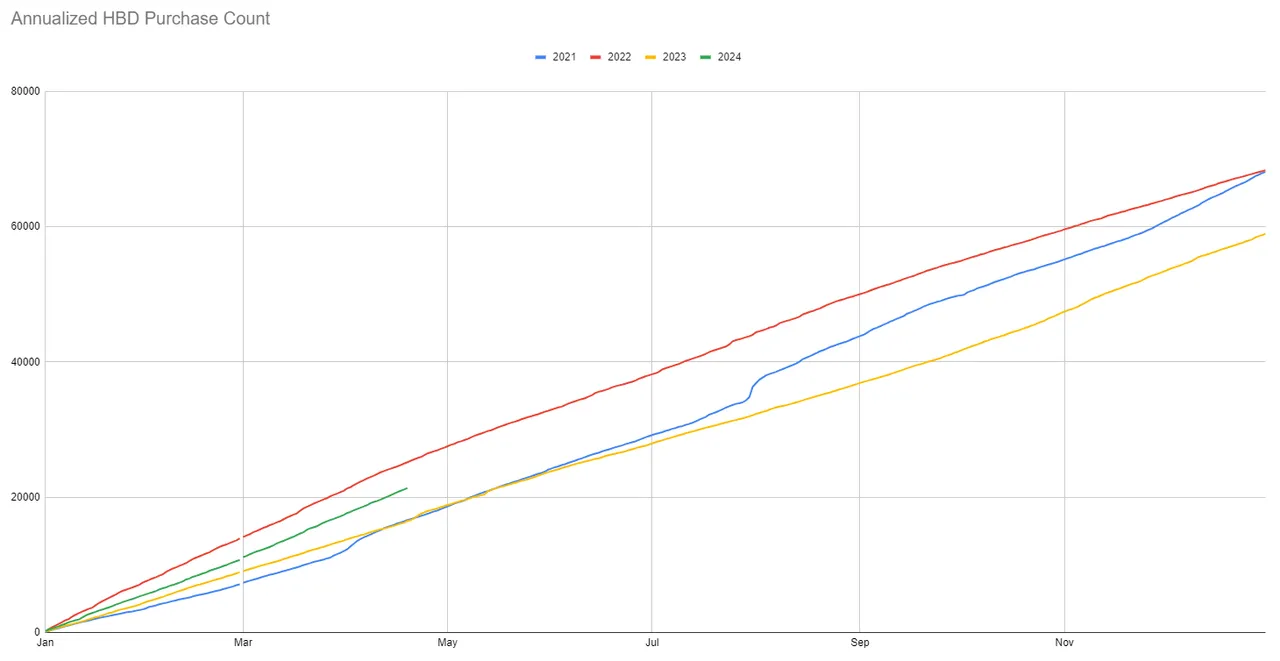
What we can see is that HBD payments in 2024 is off to a strong start, surpassed only by 2022 which was coming off $2 Hive.
HBD Value Spent
How about the actual amount of money spent? It goes without saying that a purchase for $100 has more value impact than a purchase for $1. We can see HBD value transfered per day, again with dust, trade/exchange accounts and delegation payments filtered out.
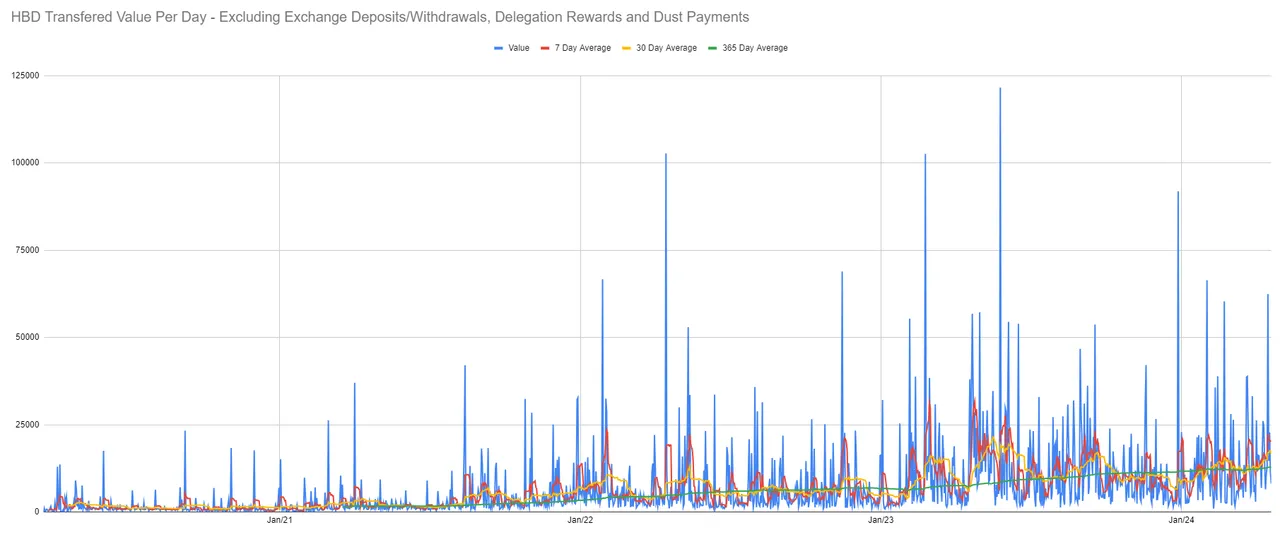
Here things are starting to look better for 2024, with the moving averages all on the rise. The same data year aligned is below.
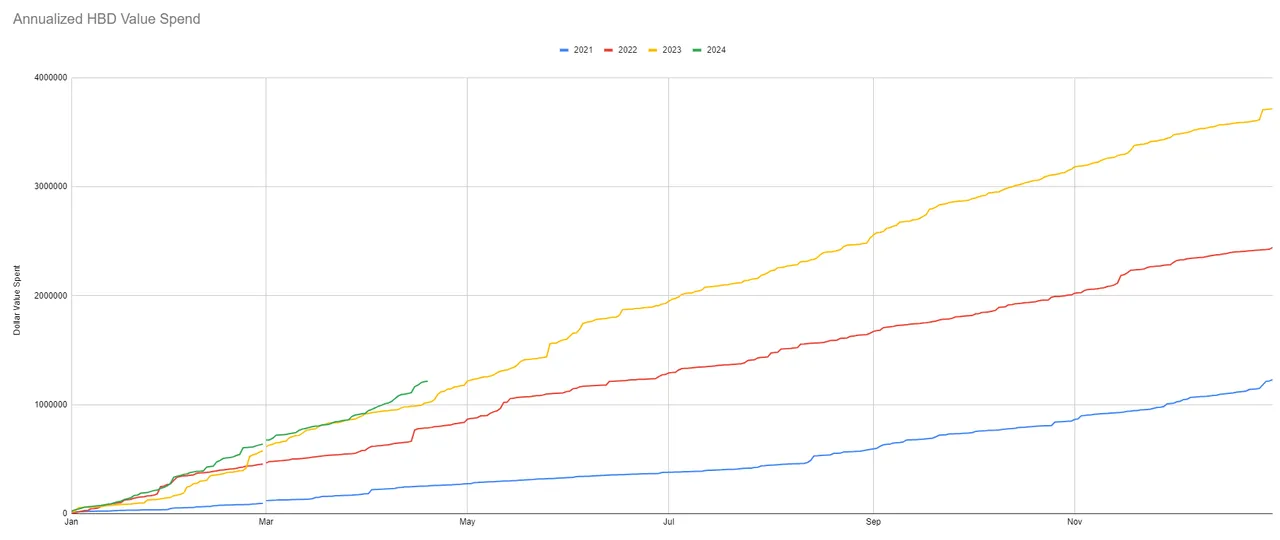
As we can see, so far spending of HBD on goods/services is higher in 2024 than it ever has been before. In fact, we have already surpassed the full year of 2021, and it's only April.
Conclusion
While still very small in scale, the use of HBD is a currency for the purchase of goods and services is on the rise. It is a trend that is increasing in value and spreading geographically to various Hive communities.
It's worth noting that in-person transactions are a minority even within purchases of goods/services. Most spending of HBD is on services which appear to be over the web - games, contests, services bloggers provide for each other and the like, though in-person spends are a significant and growing part of it.
Also, this analysis is limited by the exclusion of @v4v.app transactions. Many of those are used to facilitate purchases, but I am not sure what would be the best way to filter the 'exchange' use of the app vs. 'purchase' usage of the app.