Here is some interesting data of hive.io generated by Google Analytics.
I've used the default reports. If there's something missing, let me know. 🤓
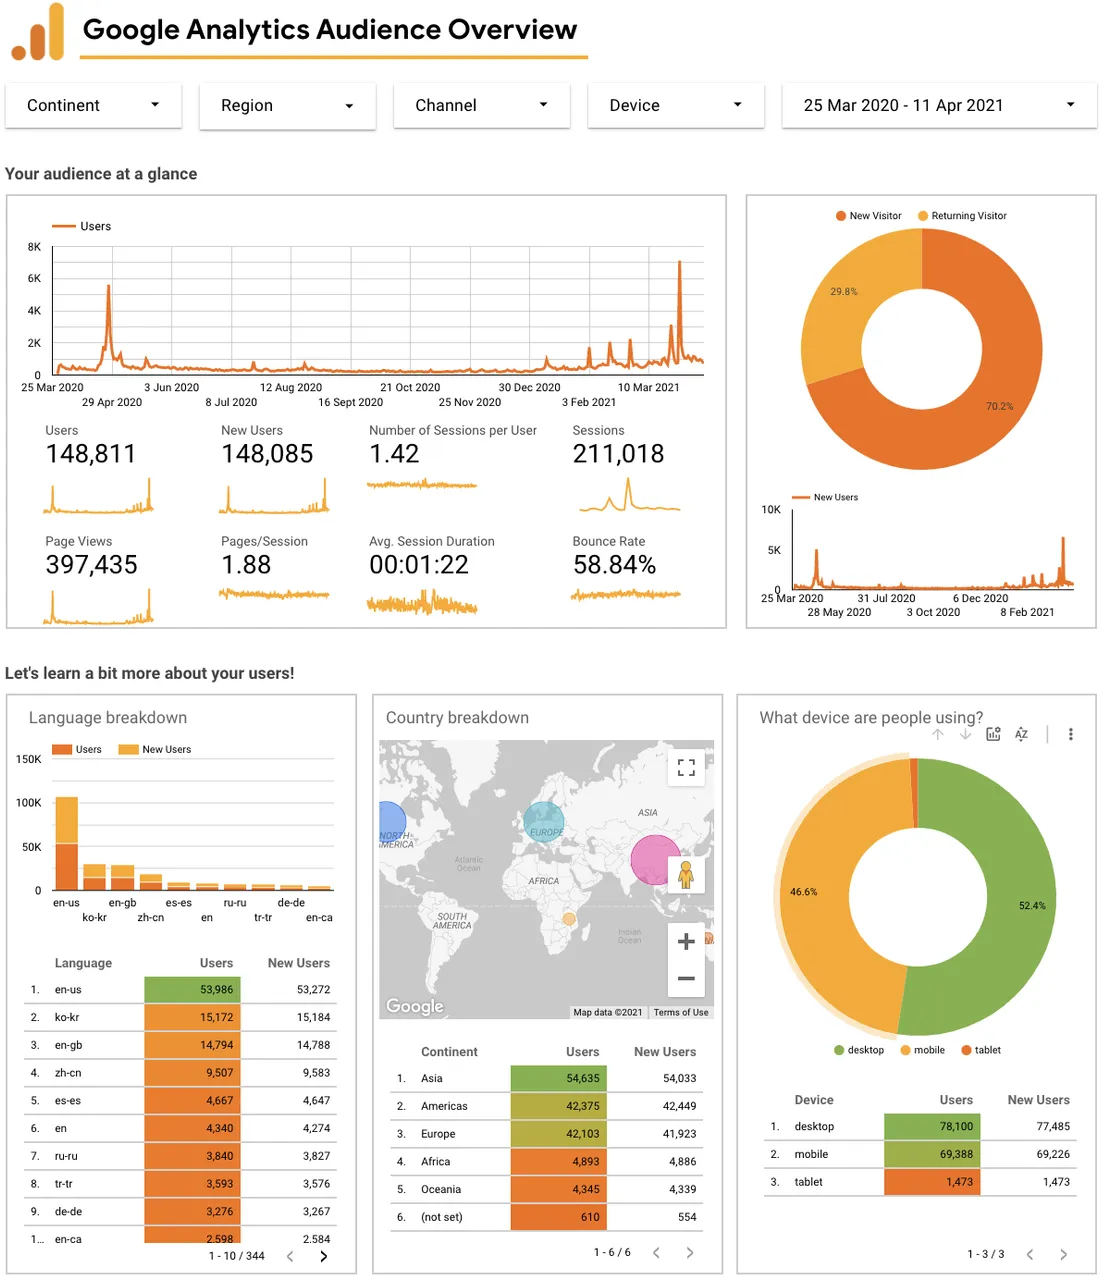
Audience Overview: From Launch to Now
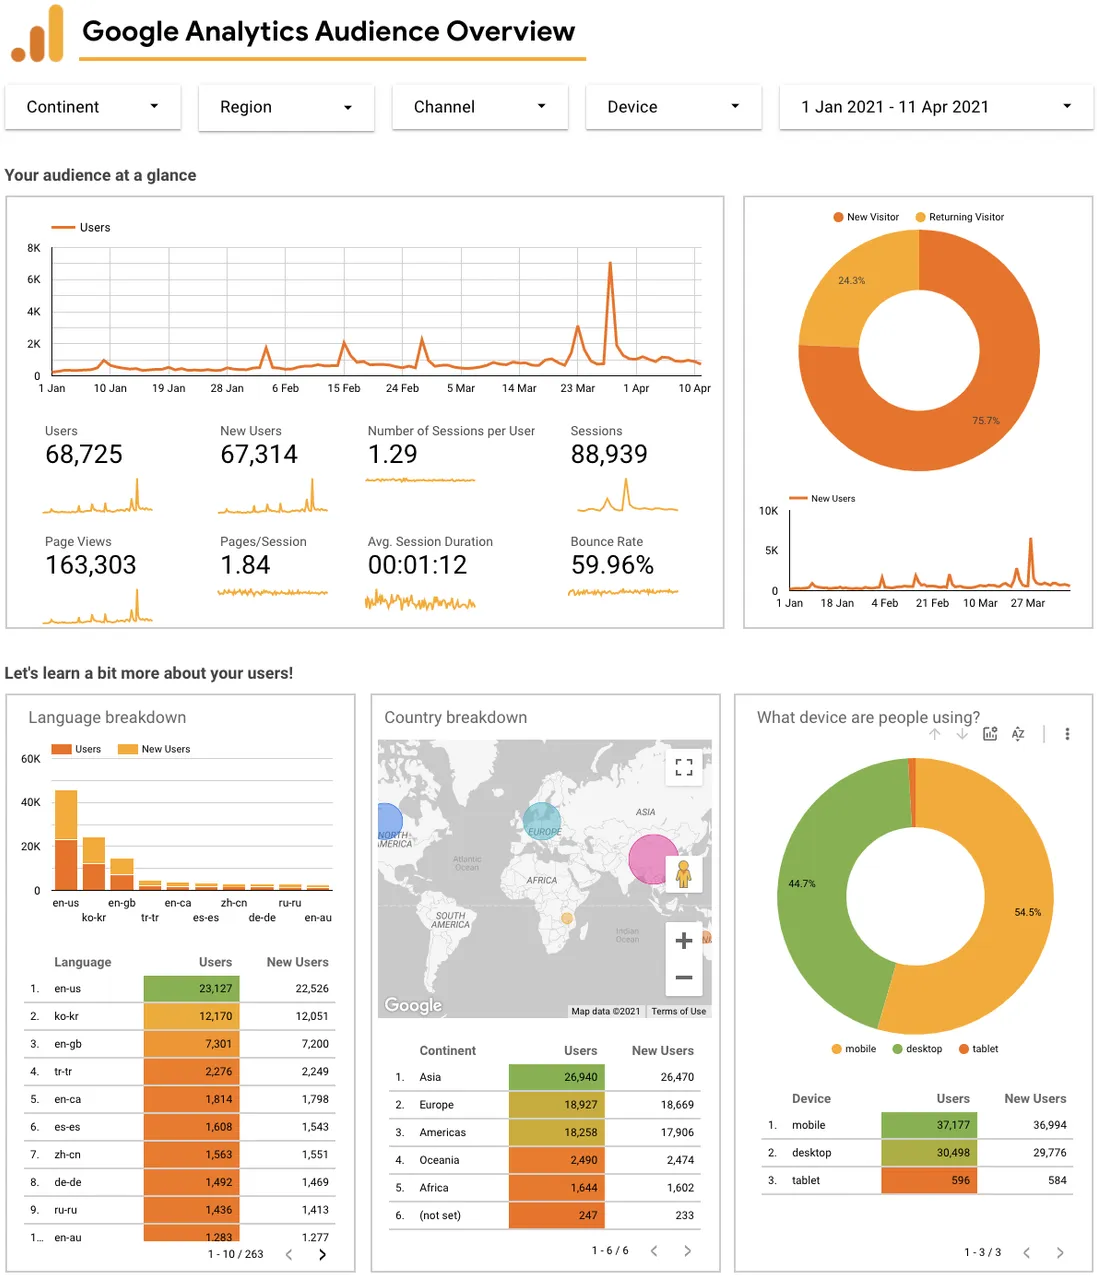
Audience Overview: From January 1st 2021 to Now
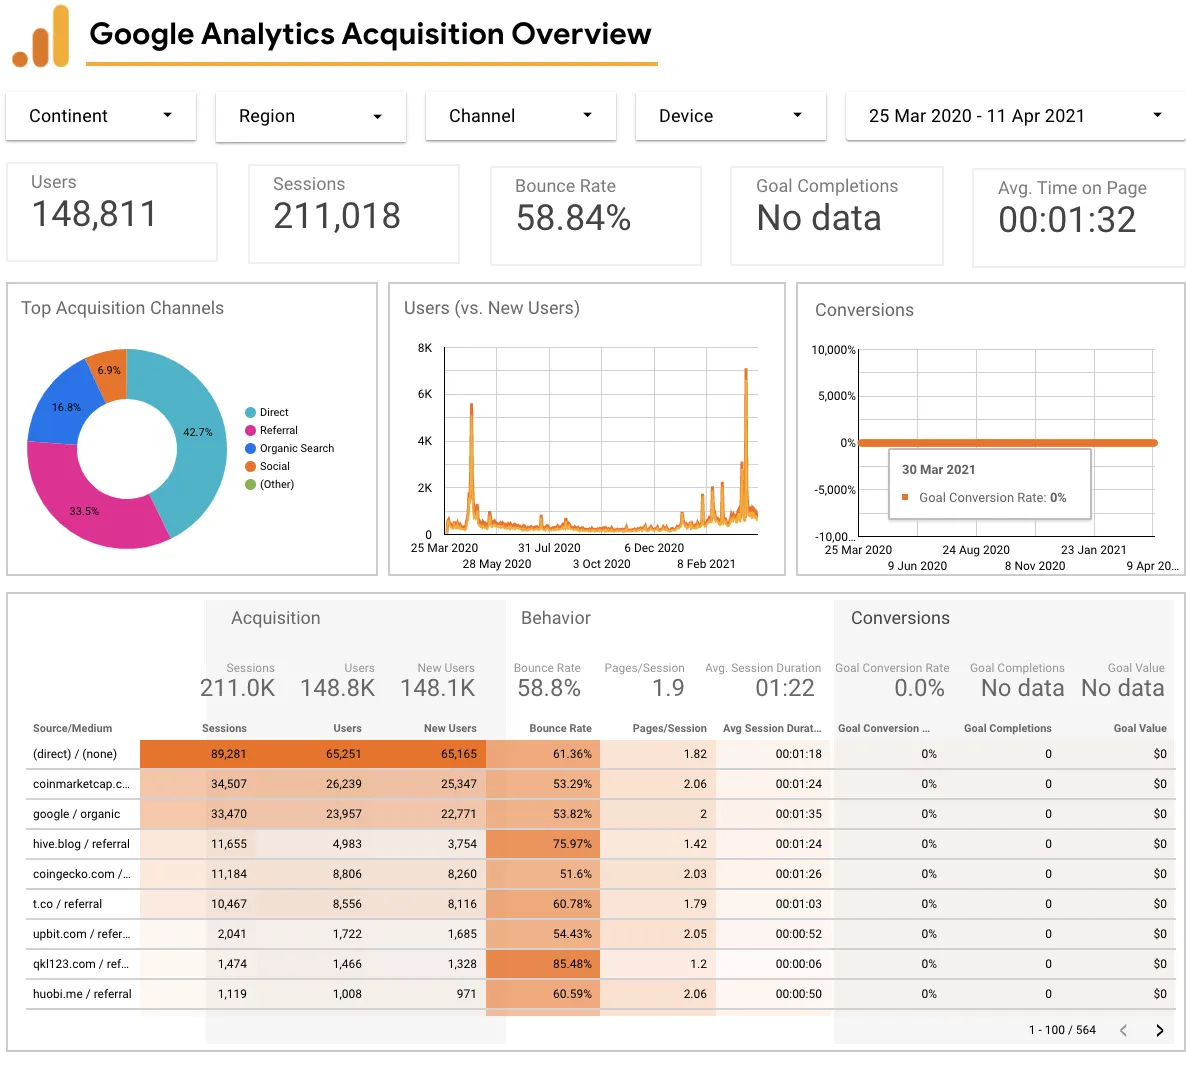
Acquisition Overview: From Launch to Now
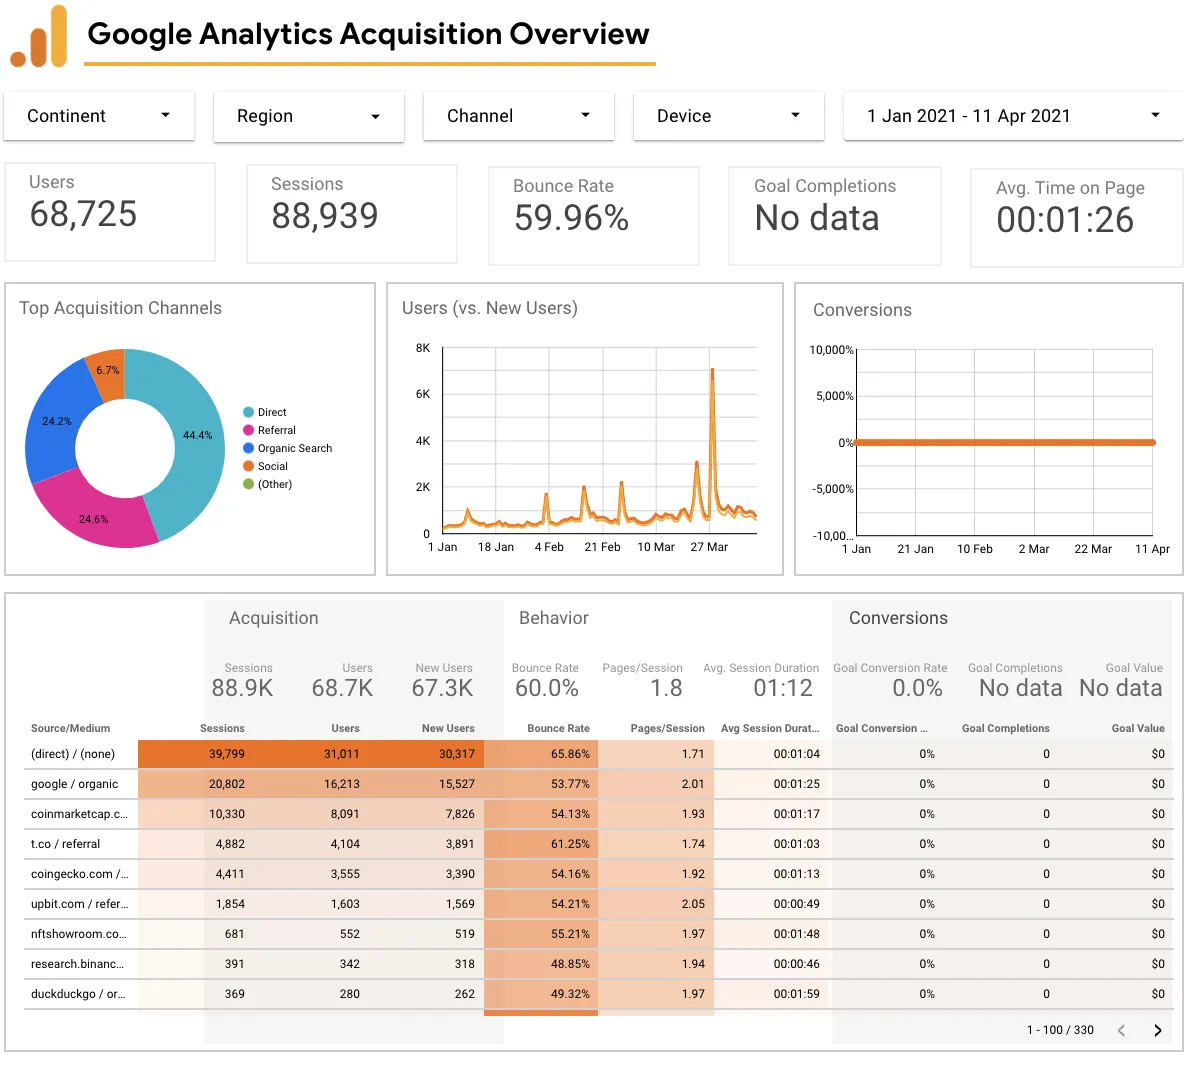
Acquisition Overview: From January 1st 2021 to Now
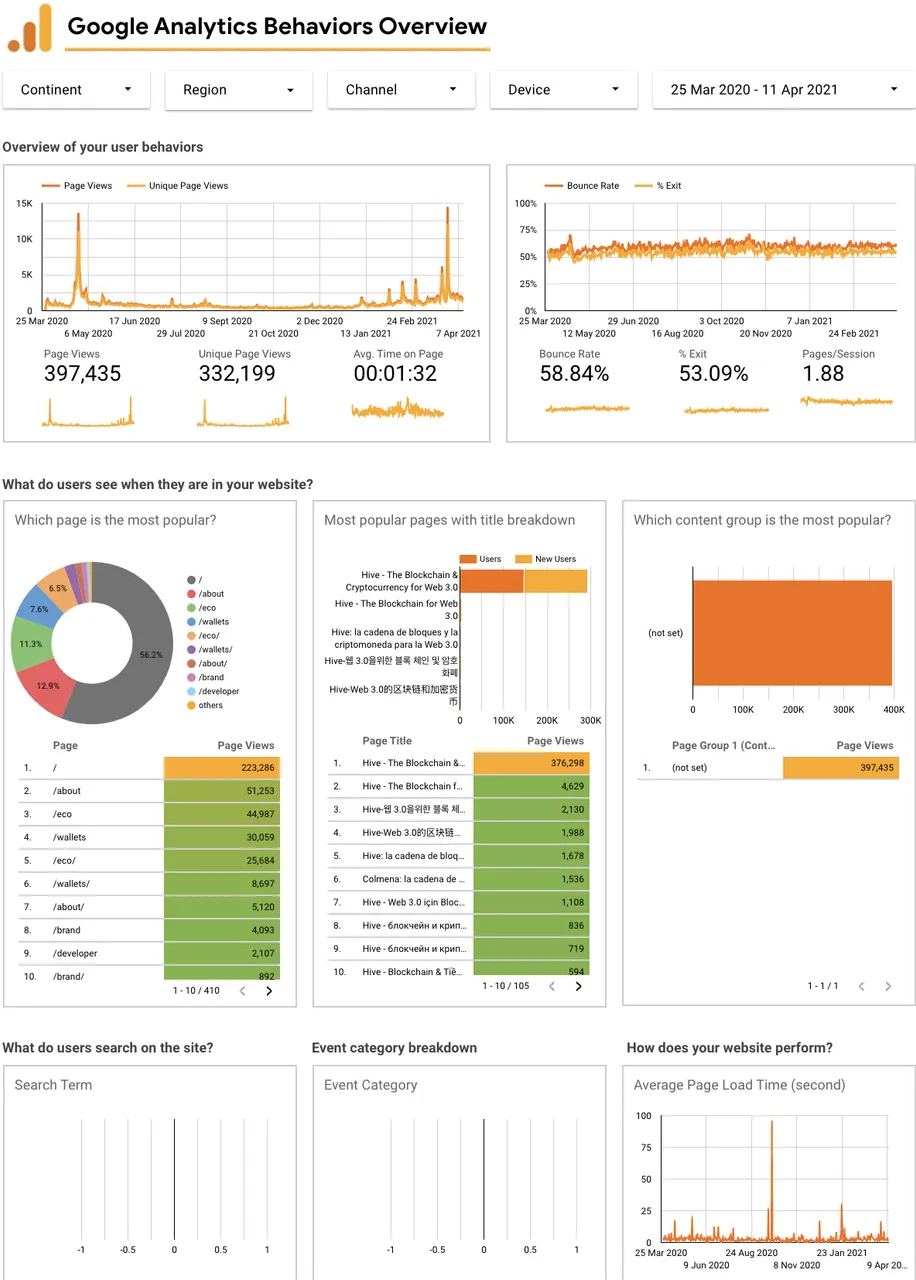
Behaviors Overview: From Launch to Now
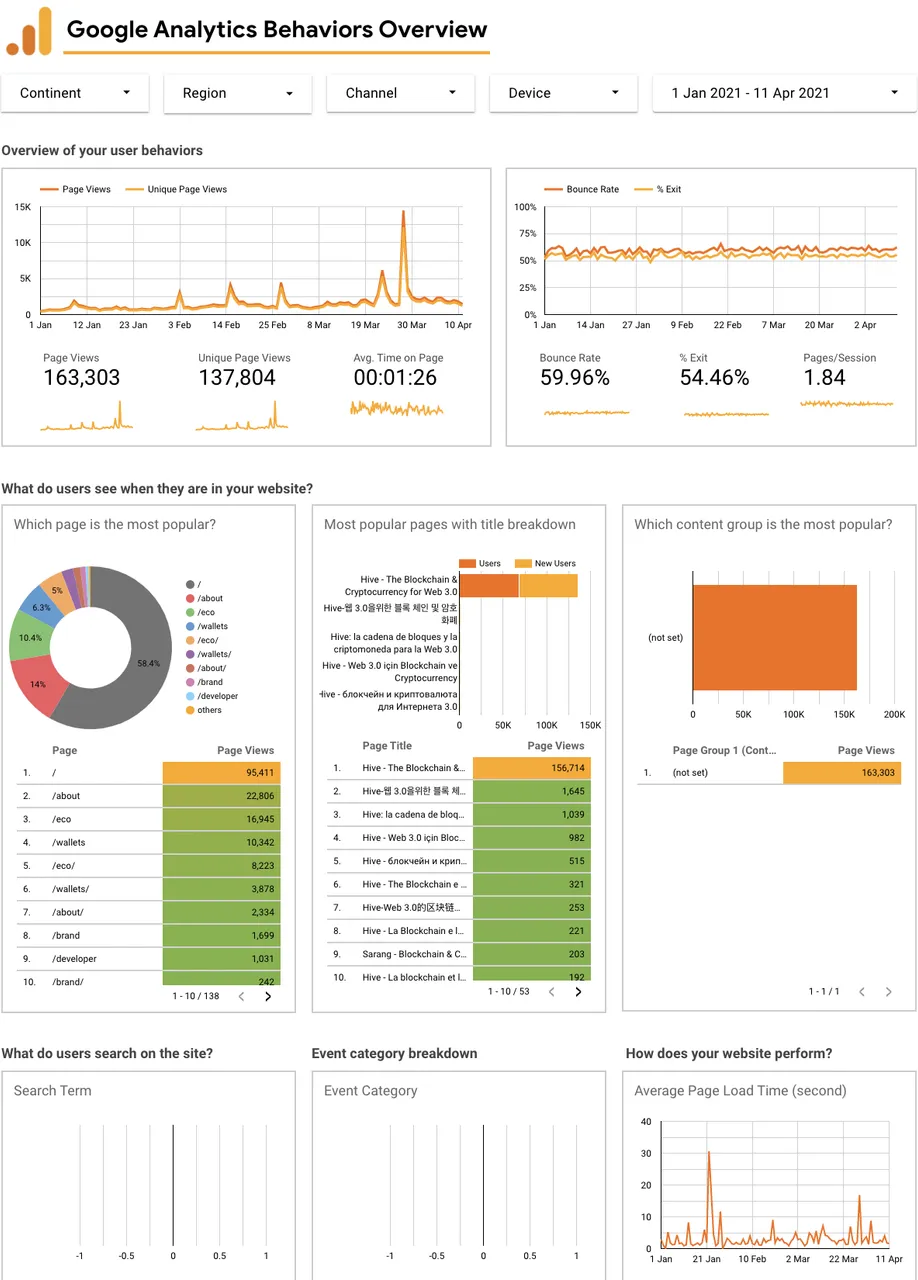
Behaviors Overview: From January 1st 2021 to Now
Footnote
I know that some people are not impressed by the design of Hive.io. And that's fine. Still, looking back, I'm somewhat proud that I was able to create it in a span of days under pressure for it to be ready for Launch on March 25th 2020. (this ofc. goes for everyone who collaborated in the launch) Especially considering that I had to come up with a theme and sexy catchphrase.
Fast.
Scalable.
Powerful.
The Blockchain for Web 3.0

Now, I'm not sure whether it's actually the best way to describe Hive, considering that tech will always advance and Hive lacks behind in some aspects, and our most powerful attribute/strength is the tight-knit community. So maybe it's time for some change.
Since the website is owned by the community, you can simply submit ideas yourself on Gitlab: https://gitlab.syncad.com/hive/hive-io. Or if that's too troublesome, just comment below. This goes for everything on the website ofc.
Note: I'm not hosting hive.io nor am I "in charge" of Hive. Just a community developer.