Hi Everyone,
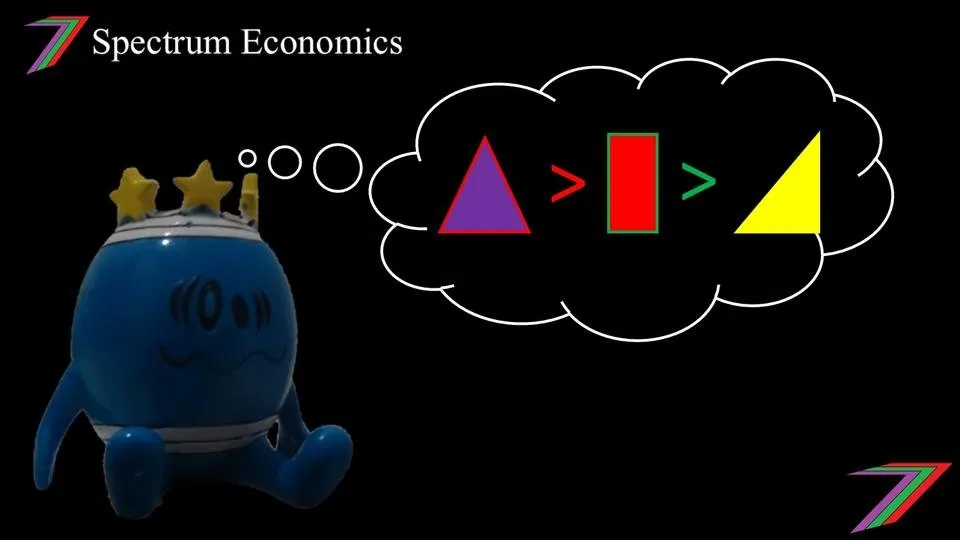
I have written several posts regarding the ‘transitivity’ assumption. I described the assumption in my post ’Game Theory #7– Transitivity’. I then explained how non-transitive relationships between sports teams can be exploited using the NFL as an example in my post ’Building a winning team (Transitivity assumption) – Focus on the NFL’. I put together another post ’Pick the Bigger Shape – All entries to receive upvotes’, which contained a simple exercise where I required participants to compare shapes and determine which shape was bigger. I compared triangles and rectangles of different sizes and colour. I had a very low response rate of just three participants. However, the three that participated struggled to determine which shape was bigger for most of the comparisons.
In this post, I want to discuss how businesses can utilise non-transitive relationships between products. There are a vast variety of products and normally several competing brands. There are many ways brands can compete with other. Two typical methods of competition are through price and product differentiation. Price competition, in the absence of product differentiation, is straightforward; the lowest priced product has the best opportunity to capture the largest market share. Product differentiation is more complex. This is particularly true for products that have multiple characteristics. Firms need to balance quality and cost of production as firms competing using product differentiation still to need compete based on price as well. Increasing the quality of the product will increase the cost and therefore the price. Firms typically target a particular audience and enhance the features that are most attractive to that audience. Firms can also market their products such that they appear superior to their competition. Knowledge of non-transitive relationships between products can help firms put their products in a more positive light.
Televisions
In this post, I would like to focus on televisions. Most people are familiar with and own at least one television. Televisions are an easy example to work with as they have multiple characteristics that buyers need to consider. Such characteristics include but not limited to:
- Picture Quality
- Size of the screen
- Sound Quality
- Features
- User Interface
- Brand Reputation
- Price
Different buyers place different emphasis on each of these characteristics. Some of these characteristics can be clearly defined and observable. For example, the exact measurements of the screen size are known and the price is labelled. Other characteristics are not so clearly defined. For example, picture quality can only be determined in respect to the picture quality of other televisions. The quality of the program shown on the television as well as the default setting of the television also influence the buyers perception of the quality of the television picture. Determining sound quality is even more difficult as sound cannot be easily compared in the same environment.
Potential buyers can read online reviews. However, these reviews are also subjective. The reviews could also be out-of-date or of a slightly different model. The reputation of the brand can be used as a guide to the quality of the television. However, newer brands could be equally as good and reliable but have not received sufficient exposure. To compensate for a less well-known brand name, firms often sell at a lower price.
There are several different markets for televisions. There are people who might want large screens and the most advanced smart TV features. There are people that are not interesting in extra features and prefer just a traditional TV experience. There are people that are looking for a less sophisticated secondary TV for the bedroom. There are people that want the best TV experience as possible (giant screen, best quality picture, super surround sound, etc.) and are not concerned about price. Different stores have different target audiences as well. Large department stores will have a very broad audience. Speciality stores would be focused more on customers with particular requirements. Discount stores will be focused on offering value for money.
Table 1 contains 8 hypothetical television models. The characteristics are scored upon 5. The table also contains weighting of the importance of each characteristic to a particular group of buyers, these scores range between 1 and 5.
Table 1: Television characteristics and scores
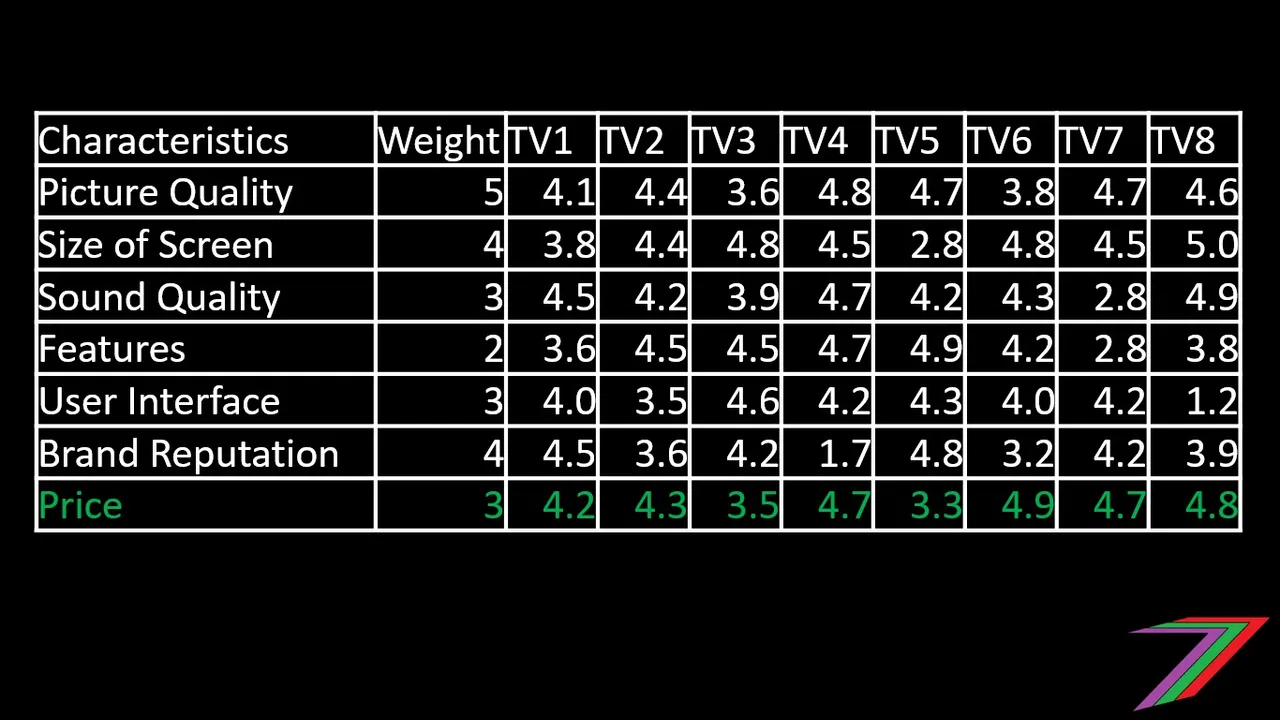
The scores in Table 1 are precise scores for each characteristic. The price has been determined as a willingness-to-pay price score rather than an actual price score. This was done so that the buyer is indifferent between all 8 televisions if all information could be completely observed.
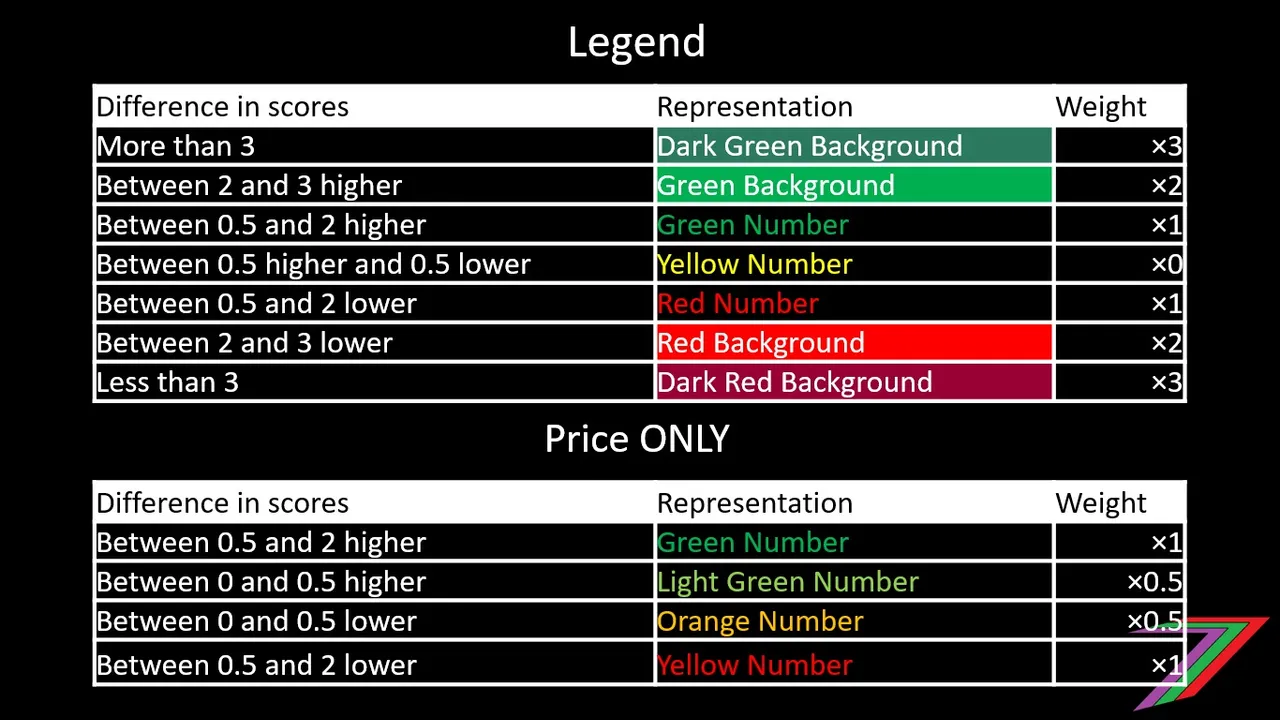
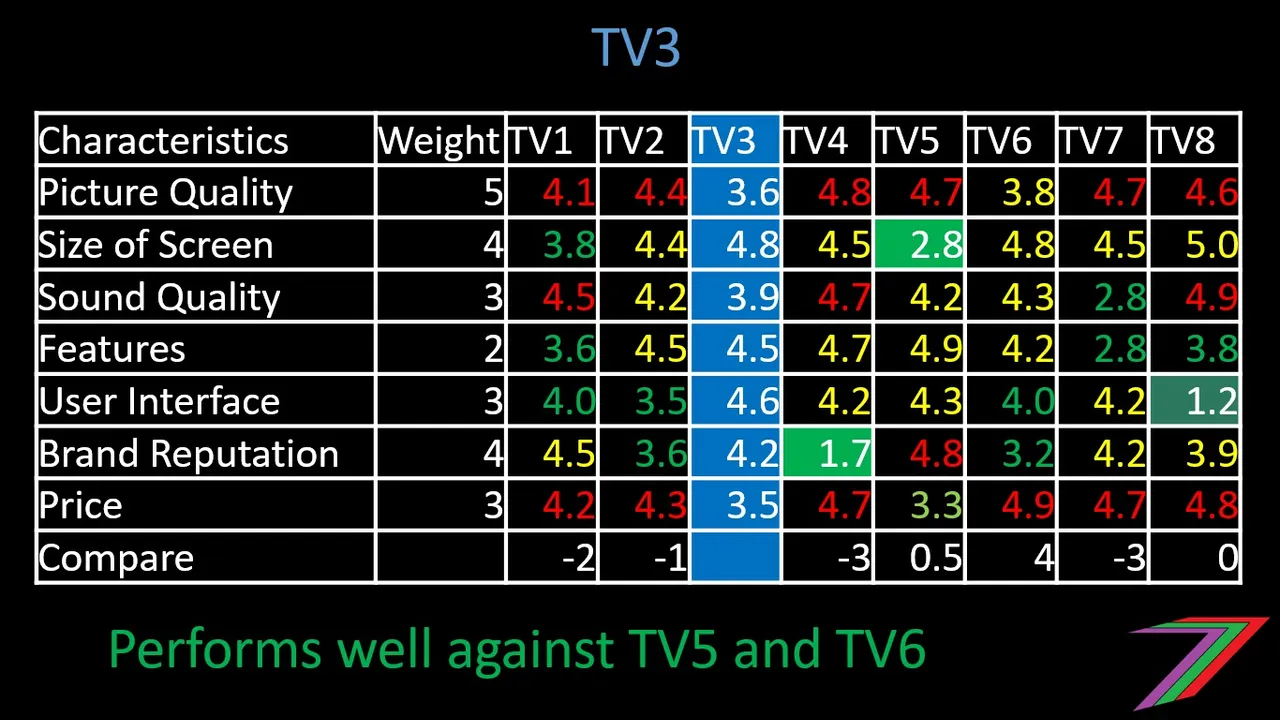
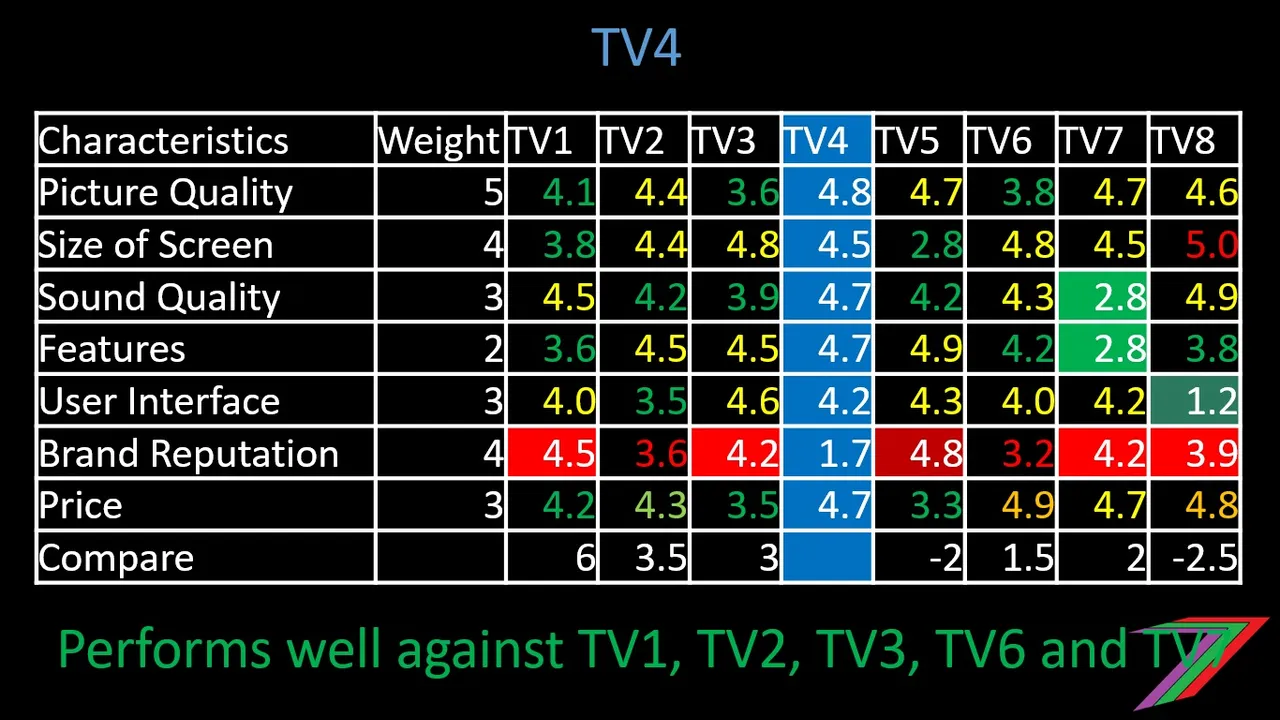
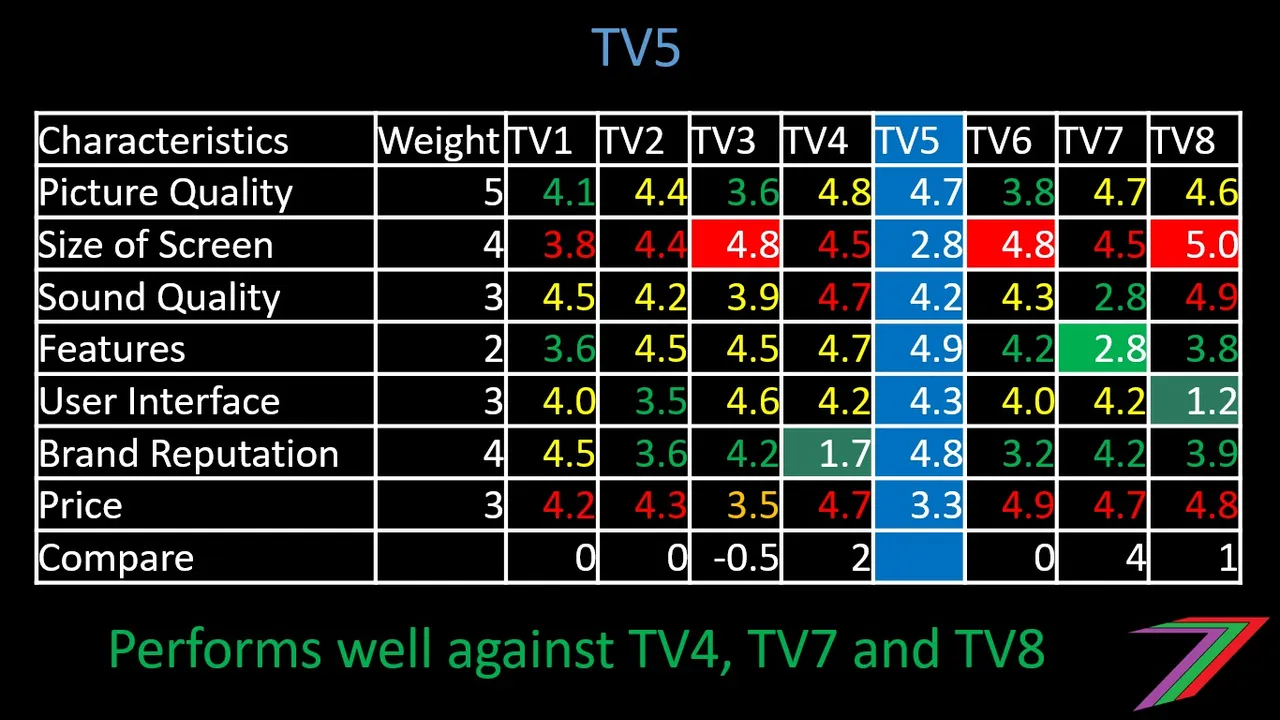
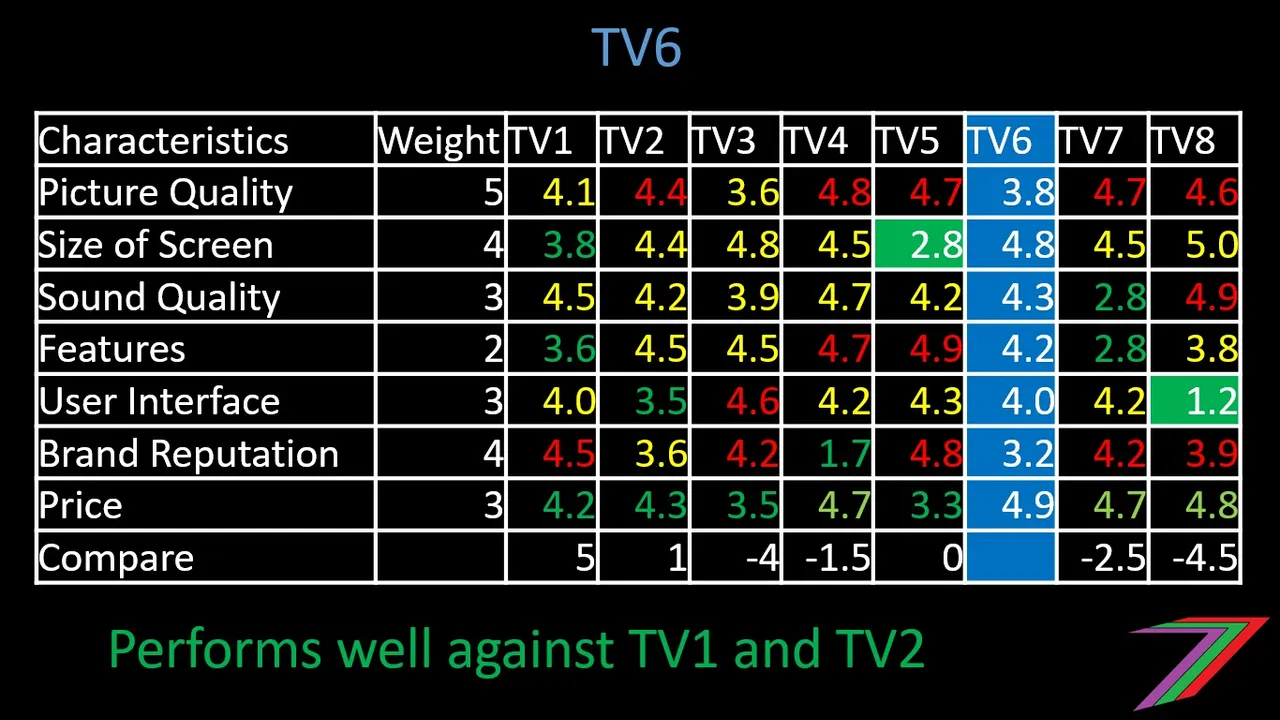
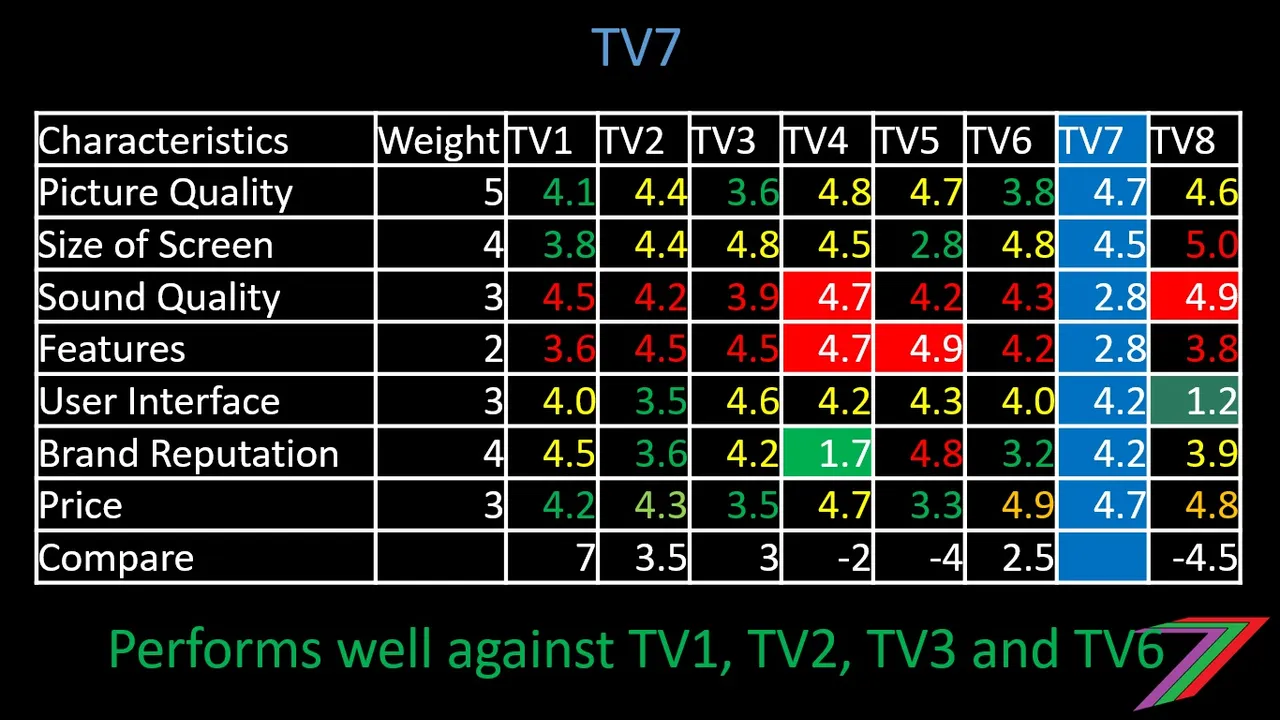
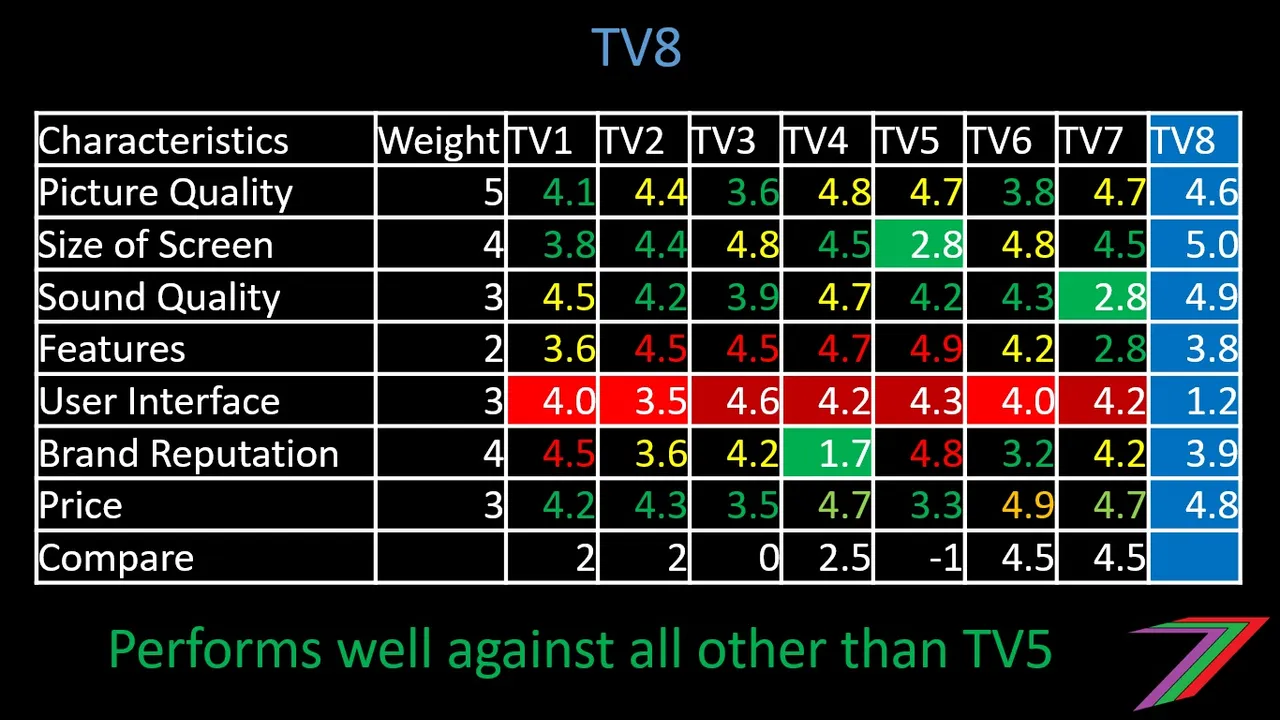
Figure 1 is a gif containing tables comparing the same 8 televisions but we are assuming that buyers cannot precisely determine the scores for each characteristic for each television. Instead, we have assumed that scores need to be at least 0.5 different for users to clearly notice a difference. Price is treated different as even a small difference is observable and can be considered at least a slight advantage.
The gif makes direct comparisons between each television. For example, when a television has an observed advantage in a characteristic, the score is in green font. The gif explains the scoring system more clearly.
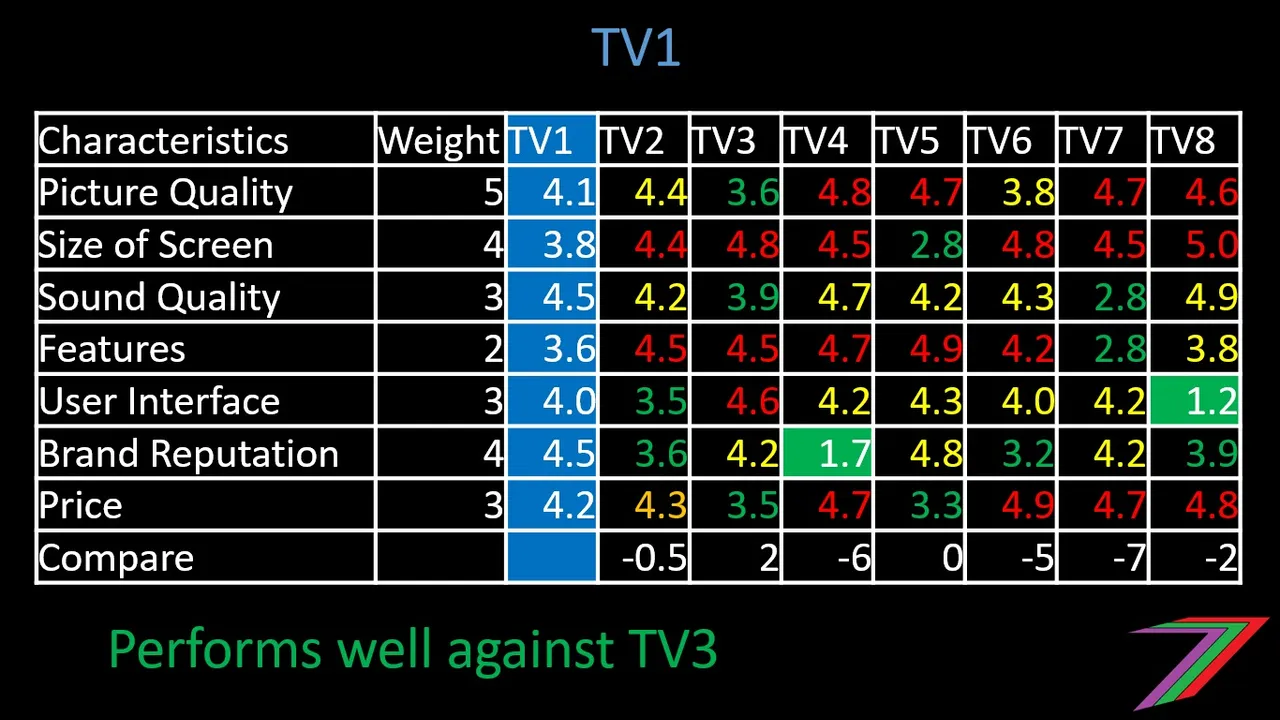
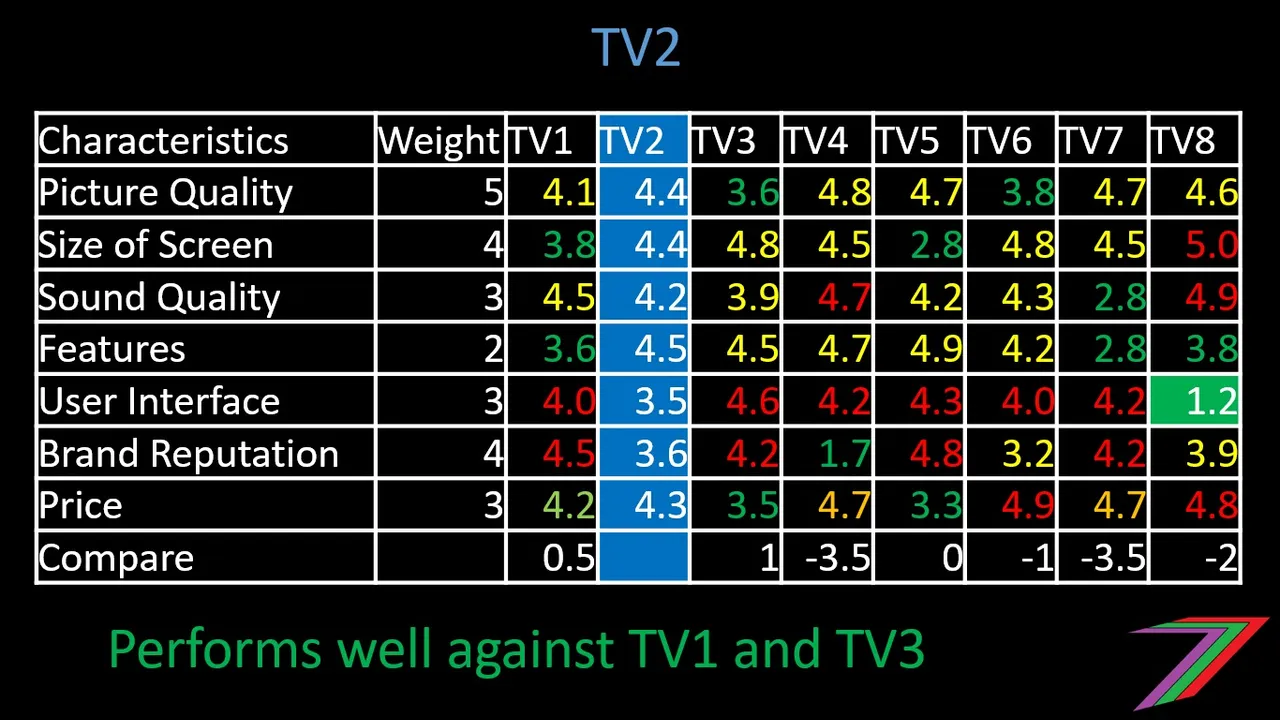
Figure 1: Gif comparing televisions

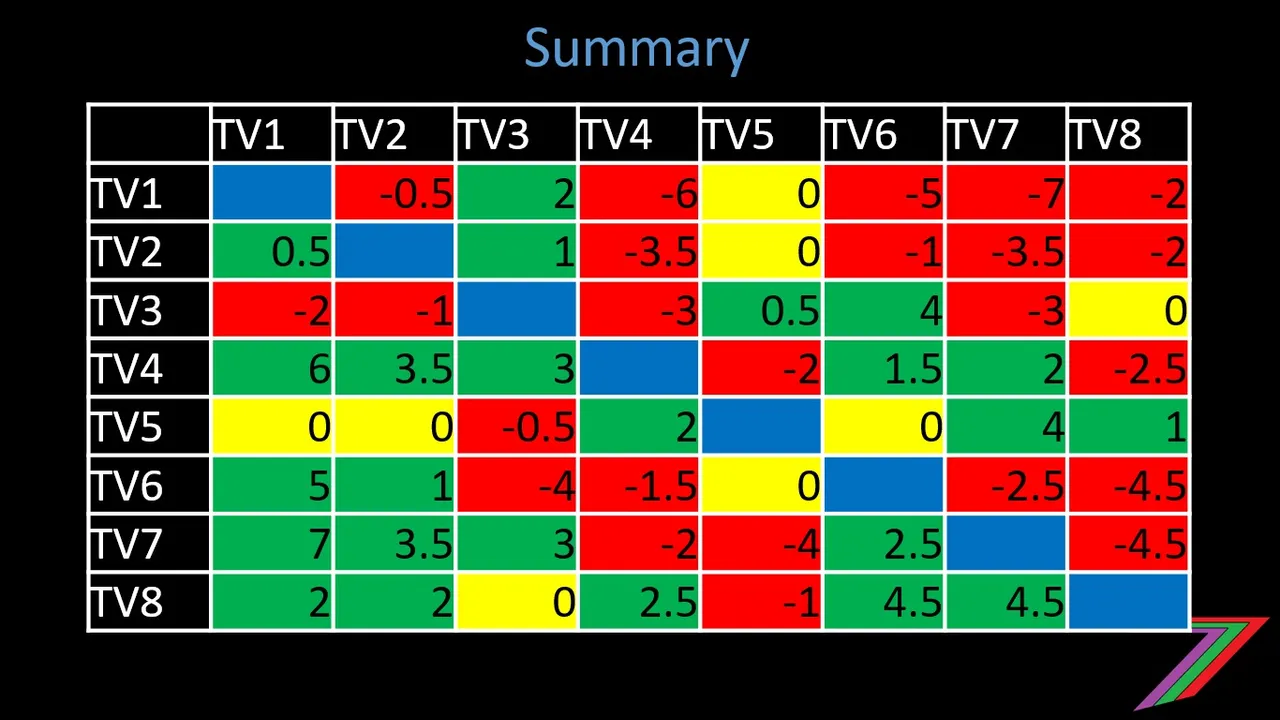
As can be seen from the gif, each television compares more favourably with at least one other television. For example, TV5 compares well against TV8, TV3 compares well against TV5, TV7 compares well against TV3, and TV8 compares well against TV7. This could also be written as TV5>TV8>TV7>TV3>TV5. This would indicate a non-transitive relationship caused by limitations of human perception.
Firms can take advantage of such relationships by placing their televisions in closer competition with televisions, which customers may perceive to be inferior based purely on a one-on-one comparison. For example, the firm that produces TV3 would want to sell it in the same location as TV5. TV3 has a much larger screen and is slightly cheaper than TV5. Whereas, TV5 competes better against less known brands (TV4) or televisions that can be demonstrated to be clearly inferior in particular areas; i.e. TV7 (sound quality and features) and TV8 (user interface).
The logic I have applied to televisions can be applied to many products that have multiple characteristics. If you are seller, understanding how to create the impression your product is superior is essential to increasing sales. If you are a buyer, it is advisable to shop around carefully to ensure that you are buying the product that best suits you and not a product that happens to appear superior because of the alternatives available in one shop.
Select the television (Exercise 1)
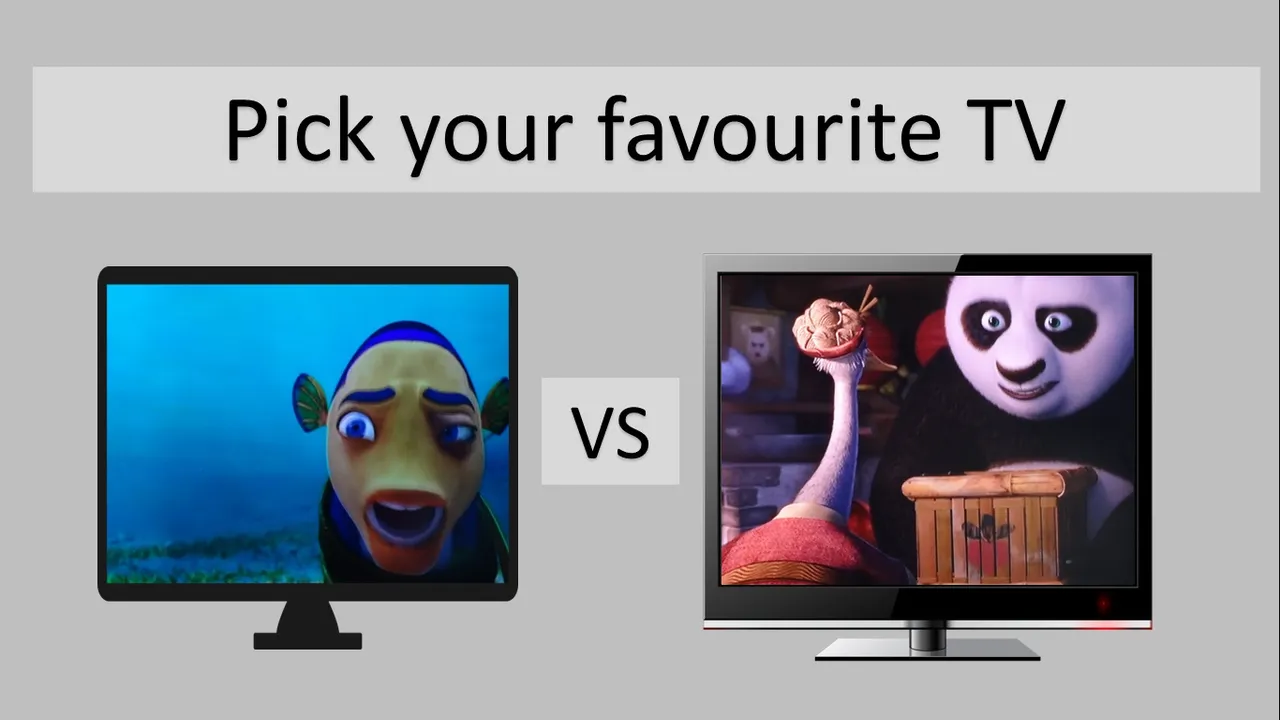
I have created a little exercise, which is presented in the gif in Figure 2. The gif compares different televisions with different price tags. The participant is required to select the television they would prefer to buy in each slide. See Figure 2 below.
Figure 2: Select your favourite Television

Format to present answers
To participate in the exercise requires an upvote of this post and a response in the comment section using a simple format of colour of slide followed by either left or right. Below is an example.
Example ONLY
Exercise 1
| Slide Colour | Answer |
|---|---|
| Orange | Left |
| Blue | Right |
| Yellow | Right |
| Green | Left |
| Turquoise | Right |
| Red | Right |
| Burgundy | Right |
| Brown | Left |
| Silver | Right |
| Grey | Left |
| Tan | Left |
| Purple | Right |
There are no right or wrong answers. Selection is based upon preference only. I will randomly select 5 responses to reward 1 Steem.
Objectives of this exercise
The exercise is an experiment to determine if there is any pattern of behaviour that can be observed from the choices people make. I am not sure what I will find. I hope the 1 Steem incentive will be sufficient to obtain a good sample of responses.
Exercise from previous post (Exercise 2)
My previous post contained a gif with different shapes on each slide. The participant was required to determine which shape in each slide was bigger. As the level of participation was low, I have included this exercise in this post as well. Those that participated in the previous exercise managed to pick the correct shape only 60% of the time. For this exercise provide the answers in following format, I will randomly (not based on the number of correct answers) select 5 responses to reward 1 Steem (same as Exercise 1).
Exercise 2

Example ONLY
Exercise 2
| Number | Answer |
|---|---|
| 1 | Left |
| 2 | Right |
| 3 | Right |
| 4 | Left |
| 5 | Right |
| 6 | Right |
| 7 | Right |
| 8 | Right |
| 9 | Left |
| 10 | Right |
| 11 | Left |
| 12 | Right |
| 13 | Left |
| 14 | Left |
| 15 | Right |
Conclusion
This post wraps up my discussion regarding the ‘Transitivity’ assumption and non-transitive relationships in a written post format. I will revisit transitivity soon in the form of videos. I will most likely visit a shop selling televisions and make some real life comparisons between models.
I hope you have found this short series of posts interesting. Transitivity is an area of game theory that is not typically explored. I also do not believe that it has been presented in an applied context such as in this post and in the ’Building a winning team (Transitivity assumption) – Focus on the NFL’ post. I will explore other areas of economics and attempt to add really life context to the theory.
Comparison of TVs in individual tables
Below are the pictures from the gif in Figure 1 for those that want to take a closer look at the example.
More posts
If you want to read any of my other posts, you can click on the links below. These links will lead you to posts containing my collection of works. These posts will be updated frequently.


Steem - The Future of DApps