Hi Everyone,
In my previous video, Spectrum Economics Six Week Challenge 3 – Price Calculations, I presented a spreadsheet which I used to calculate the price of commodities for a contest. This spreadsheet was customised to calculate the prices of four relevant commodities. This worked well for the challenge but this also means that I need to recreate the spreadsheet every time I want to run a similar challenge.
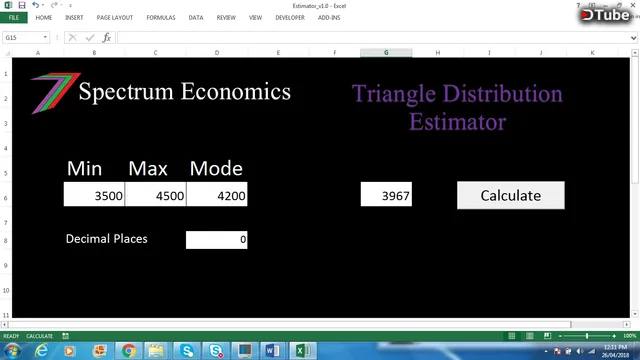
Initially, I did not intend to run anymore challenges of this nature, therefore, the one-off nature of the spreadsheet did not matter. After seeing the popularity and the potential of running similar contests, I decided to take a look at building a reusable triangle distribution model using Microsoft Excel. It turns out that it was not that difficult and does not require advanced software such as @risk or other types of Monte Carlo Simulation Models or even random number generators. The random number generator function in Excel was quite sufficient as a base to work off. Using a combination of lookup tables, what ‘if’ statements and the Excel built-in number generator, I was able to build a number generator for any triangle distribution.
In the video, I demonstrate how this very basic model works by calculating a random value using a triangle distribution determined using an entered minimum, maximum, and mode values. As you will see from the video, the values calculated fit quite nicely into the distribution and should prove to be sufficiently accurate for future contests.


▶️ DTube
▶️ IPFS